Stock and Housing Market Long Waves
Stock-Markets / Stock Market Valuations Mar 25, 2009 - 12:19 PM GMTBy: Andrew_Butter

 I got it - that's why Bernake (and Geithner) are flying the plane into the ground. The most common cause of air crashes is when pilots fly planes into the ground. The reason they do that is that they get confused about where they are. 23rd March 2009 Chairman Bernanke said that if a couple of trillion hadn't been thrown into the fire, then Plumber Joe (and sweet Mary Lou) would have lost 70% of their 401K by now not 40%; (and presumably their house too). Pity he didn't get around to that conclusion in early 2007 and cut rates to zero then, rather than hanging on for ages telling everyone that everything was under control "so as to instill "confidence"", I quote from his presentation to Congress in May 2007: " At this juncture, however, the impact on the broader economy and financial markets of the problems in the subprime market seems likely to be contained”.
I'm not trying to score points; all I'm trying to say is that although the Chairman might be great pilot, he doesn't have a great reputation for "navigation".
I just twigged, perhaps he thinks we are in 1930 (equivalent) not 1940 (which was co-incidentally about the time when FDR put the rabid cat of MTM in a box)?
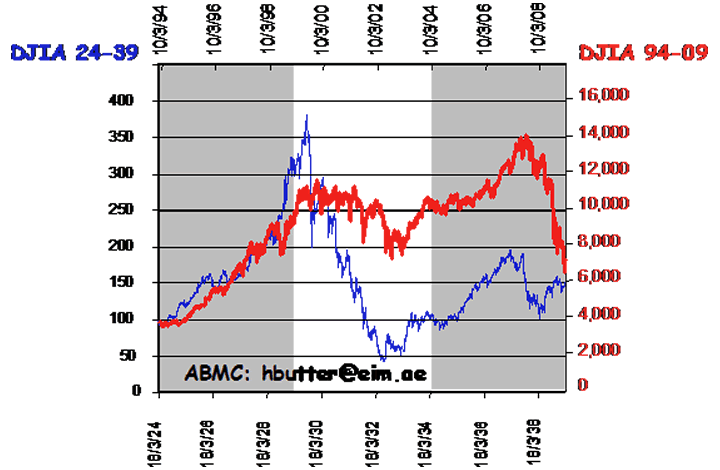
Here is a chart of the DJIA from March 1924 to March 1939 (15 years) and from March 1994 to March 2009 (also 15 Years (i.e. same timescale)).

The axis on the right is the axis on the left multiplied by a factor of four.
OK the "pattern" of the '30's/40's and the '90's/00's is different, mainly because after the 1929 crash the government just did nothing. By contrast by 2000 we had "monetarism" so a sharp decline was avoided thanks to "Savior Greenspan", but it's hard to avoid the inevitable when a wave breaks as Big Ben just found out, no matter how many trillions you throw at the problem. (The best strategy by the way is not to let a bubble develop in the first place - more on that later).
• On 6th September 1924 the DJIA was 101, five years later it peaked at 378 (a multiple of 3.75 over five years), and in 1939 it was 150, which was 1.5 times more than it had been 15 years before.
• On 13th January 1995 the DJIA was 3,908 (round numbers), it peaked after five years at 11,724 (a multiple of 2.95), and the again on 12th October 2007 at 14,093 (a multiple of 3.6). What happened was (a) Greespan (belatedly) saw the bubble and pushed up interest rates to cool things down (it worked); then he pushed rates down and "eased" to re-inflate the bubble, and created the housing bubble.
(Then Bernake "noticed" that there was a housing bubble, pushed up rates, and the wave broke, which for housing was about time, except it might have been niceer to have "soft" landing).
Anyway, based on that (and other analysis) I say DJIA bottomed at 6,574, which was (about) 1.7 times more than it had been 15 years before (that's about the ratio of the UP to the start for the Great Depression, which makes sense to me since this fiasco, although it's bad, isn't (quite) that bad.
Of course that could all just be a coincidence.
After all there is inflation (it doesn't change much even if you measure it properly), but in any case what's probably not a coincidence is that the long-term interest rate compounded from 1924 to 1939 was about 150% ("about" because I'm using annual data), and about 180% from 1995 to 2009 (March).
That's another reason why I figure the bottom was 6,574, not to say there won't be a dip, but I would be surprised if it goes down under.
Market Long Waves
When I was younger, thinner and smarter, I used to surf. I was pretty useless, but I learned one thing which is that when you are on your own you need to fix on a landmark on the shore (preferably two, best three) so you don't drift.
I also learned (the hard way) which end of the wave is most dangerous, (it's the bit when it breaks, get that wrong and you can be underwater a long time; and sometimes you run out of air which is inconvenient particularly since you don't actually know which was is up (navigation again)). What I'm trying to say is that it's a good idea to know where you are on the wave.
OK comparing the Great Crash with this one is not particularly scientific; the scientific way is to do an "Other-than-market-Valuation", using International Valuation Standards (IVS); which I have explained ad nauseam in previous articles.
What that tells you is what the price would have been if the market was not in what IVS calls "disequilibrium" which happens typically when either (a) banks lend money stupidly (causes bubbles), or (b) banks go broke (busts).
The theory is that sometimes banks act responsibly and reasonably, or if not they are reckless approximately for the same period of time they are in a state of abject terror (that's what economists call the efficient market hypothesis).

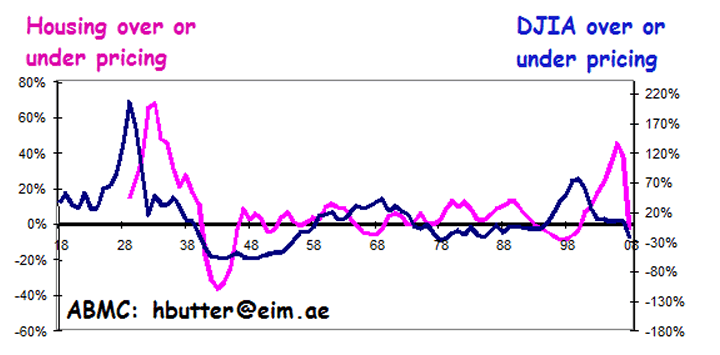
Anyway so divide the "price" (DJIA and S&P Case-Shiller) against the "other-than-market-value" (take away one so it gives a % over-pricing, you get a picture of the cycles of over and under-pricing:
I could talk about that chart all day, but reference the point of this article:
1: The house price bubble after the Great Crash was a result of the drop in economic activity (house prices adjusted slower). The important thing is that the house price maximum disconnect followed the DJIA maximum disconnect.
2: A "wave" above the "line" (that's the line of other than market value which is Zero on the chart), is followed by an equally large "wave" under the line.
So just eyeballing the chart I would say we are about 1940 compared to the Great Depression.
Which means that now would be well over time to take the rabid cat of MTM and stuff it in a box. Fortunately also we now have International Valuation Standards, which are accepted by all valuation institutes of any consequence in the world, which (a) say that rabid cats should be stuffed in boxes and (b) explain how to do a valuation without the help of a rabid cat.
Ah but what happened to the Recession?
Ah you say, that's nonsense, you got to be as crazy as a coot, what about the Depression, or Recession??
Well actually USA went into recession in 2000, just no one noticed because CPI wasn't worked out correctly, and for that reason everyone went on a spending spree they could not possibly afford (which is one reason we have had an uncomfortable landing instead of a soft one).
Mike Shedlock has a good article on that (he references some mysterious person called "TC", http://www.marketoracle.co.uk/Article7651.html ; this however doesn't explain why that happened, so I will explain briefly.
Working out CPI is a valuation, it's an estimate of the market price of stuff today compared to a year ago. Bizarrely in the USA this number which is the corner-stone of "monetary policy", which used to be all the rage, is worked out by the Bureau of Labor.
Why anyone would think that the Bureau of Labor. knows anything more about doing a valuation than for example the Department of Agriculture is beyond me, although one thing is abundantly clear, they don't.
Instead of working out the actual cost to the population of owning houses to live in (too hard), they work out "rental equivalence" which "assumes" that the cost of owning a house is the same as the cost of renting one. To anyone who knows anything about valuation that is simply idiotic.
First: 60% of people in USA are owner-occupiers (and since people who rent are as they say "low rent", that probably accounts for 90% of the money spent on owning houses to live on).
Second: Everyone who knows that when you value say a duck you need to get information on DUCKS (they walk around on two legs and go quack), not donkeys (which have big ears and bite).
The fact that no-one in the administration in USA appears to be able to work that out for themselves, does increase my suspicion that Chairman Bernake and Secretary Geithner, are lets say "navigationally dyslexic".
The Good News
The good news is that it looks like USA is almost out of the cycle of insanity that started in 1995, what happens next depends of course on the pilots (and I do wish they had the right maps).
Here are the options:
1: Bernake and Geithner can grab another trillion or two and throw it into the fire, that is unlikely to achieve anything much, except reduce USA to a 3rd World Country (cheap house anyway); that's the equivalent of flying the plane into the ground, so queasy passengers might like to jump off (if they have parachutes).
What will happen is the dollar will plunge, long term interest rates will go up, and the pain will go on a lot longer.
2: Either way, it looks like the "toxic asset shakedown scheme" won't work, because the banks won't sell at those prices, which is a relief. But at least that served a purpose as a talking shop.
3: With luck they will come to their senses and mandate International Valuation Standards as a way to value toxic assets for the purpose of assessing capital adequacy or solvency (although I'm a little concerned about the fact that although both Bernake and Geithner acknowledge that "valuations are important", they don't apparently appear to have heard of the ONLY valuation standard that is approved and accepted by every valuation institute in the world (back to navigation again)).
If that happens then the banks are probably out of trouble by now so, once mark-to-market is in the bin, they can start lending again.
By Andrew Butter
Andrew Butter is managing partner of ABMC, an investment advisory firm, based in Dubai ( hbutter@eim.ae ), that he setup in 1999, and is has been involved advising on large scale real estate investments, mainly in Dubai.
© 2009 Copyright Andrew Butter- All Rights Reserved
Disclaimer: The above is a matter of opinion provided for general information purposes only and is not intended as investment advice. Information and analysis above are derived from sources and utilising methods believed to be reliable, but we cannot accept responsibility for any losses you may incur as a result of this analysis. Individuals should consult with their personal financial advisors.
Andrew Butter Archive |
© 2005-2022 http://www.MarketOracle.co.uk - The Market Oracle is a FREE Daily Financial Markets Analysis & Forecasting online publication.


