Update of the US Dollar Index Forecast
Currencies / US Dollar May 10, 2007 - 10:41 PM GMTBy: David_Petch
I thought it would be good to post the USD action of late and why it is affecting other markets. I will not be posting any other technical analysis reports for sometime. Instead they will be research-related topics over the course of the next 4-6 months. An article I plan on releasing 3-4 weeks from now is titled “Busy Bee Bugaboo and Another Unsuspecting Agent of Doom”
( http://treasurechestsinfo.com/Nuke/modules.php?name=News&file=article&sid=157 ). As such, lets get down to business.
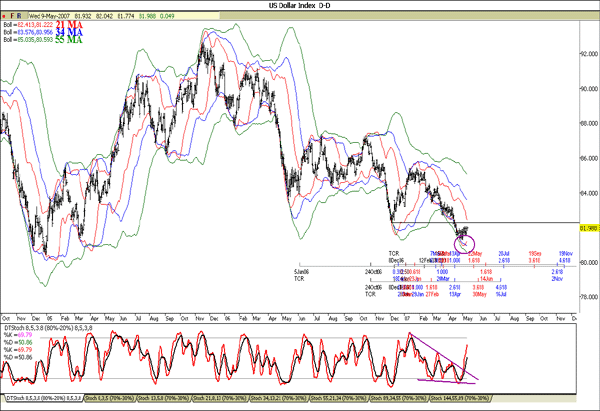
The lower 55 MA Bollinger band is still drifting well below the current index value, suggestive a base has not yet been established. The upper Bollinger bands are still declining, suggestive the USD has another 4-6 weeks of grinding higher before a top is put in place. Fibonacci time extensions of various waves are shown near the lower portion of the chart, with various Fib dates in late to early July. Short-term stochastics have the %K beneath the %D, with another 1-2 weeks of upside at a minimum before a brief downside move occurs (only to resume a grinding upward trend to 83-83.5).
Figure 1
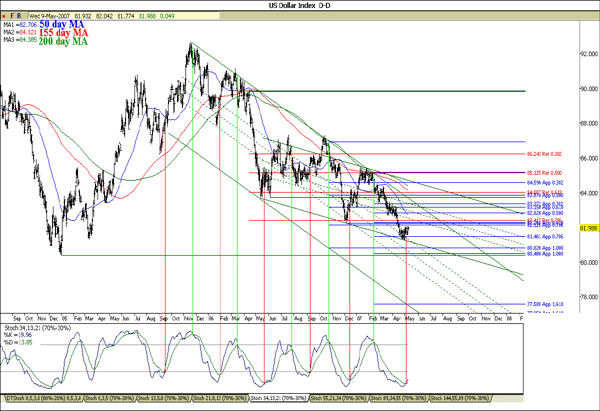
Blue lines on the right hand side represent Fibonacci price projections of downward trending wave price action projected off the subsequent retracement. Red lines represent Fibonacci price retracements of the move from early January 2005 until the late April 2006 top. Areas of line overlap form Fib clusters, which indicate important Fib support/resistance levels. There is strong resistance around 82.2-82.4, so expect the sideways action to continue until this level is taken out. One Babson channel contains the footprint of the USD from November 2005 till present, while another contains June 2006 till present. Notice how both channels form a wedge that terminates anywhere from October 2007 until January 2008, depending upon how the channels are drawn. Based upon this observation, the decline in the USD for this leg down could continue for some time. Moving averages are in bearish alignment (200 day MA above the 155 day MA above the 50 day MA), with the 50 day MA acting as support at 82.706. Full stochastics have the %K above the %D, with at least 4-6 weeks of upside if the %K reaches the upper horizontal channel line. This suggests “do not go short on the US dollar”. The USD could continue to drop, but based upon the technical's, there is a possibility for the upward grinding action to continue.
Figure 2
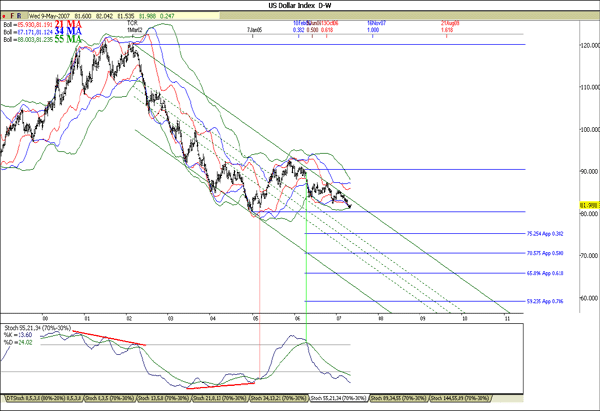
The weekly USD index is shown below, with Fibonacci time extensions of the decline shown at the top of the chart and Fib price projections of the decline projected off the April 2006 partial retracement on the right hand side of the chart (denote din blue). The lower Bollinger bands are in close proximity, suggestive the USD decline is set to continue after the current retracement move is done. The upper trend line of the Babson channel has proven to be strong resistance, with resistance around 83-83.5. A decline in the dollar below the 80 cent level would cause severe economic losses for many global pension funds, governments and investors, so it is highly unlikely that the dollar will NOT continue to receive support from foreign countries. As such, expect the USD to remain above 80 until late 2009/early 2010. Full stochastics have the %K beneath the %D, indicating the downward trend in place since April 2006 is not yet over. A bottom is likely due between October 2007 and January 2008.
Figure 3
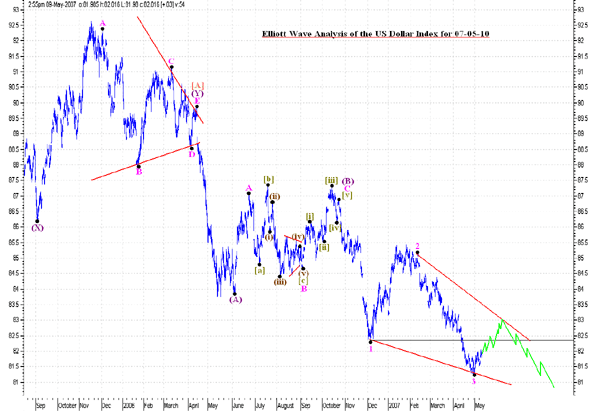
The mid-term Elliott Wave chart of the USD index is shown below, with the thought path denoted in green. The USD should retrace the decline to somewhere between 83-83.5 before continuing the descent to the 80.3 level later this year. Wave [B] is taking the form of a flat, with wave C forming a terminal impulse (3-3-3-3-3). There are numerous ways to count waves 1,2 and 3 but for simplicity, I have kept the count only labeled to the Minor Degree (pink). The upward move should continue until mid to late June before declining slowly into October 2007 or later.
Figure 4
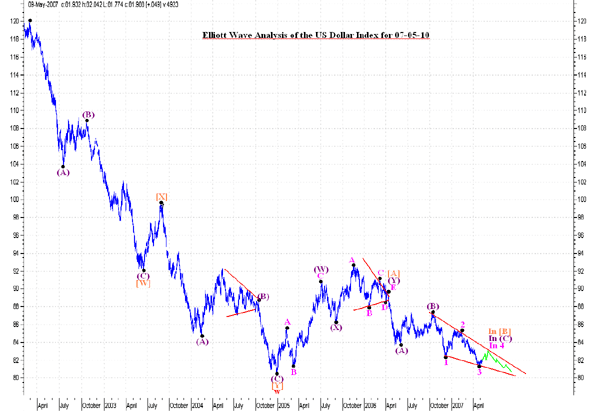
The long-term Elliott Wave chart of the USD index is shown below with the thought path denoted in green. Wave C.(W).[A] and [c].W.(X).[A] were elongated flats; elongated flats usually occur in triangles, which lead to the hypothesis that a non-limiting triangle is currently developing. After wave [B] completes, wave [C] should head back up higher to 83-84 over the course of mid to late 2008.
Figure 5
That is all for today. I will update the S&P 500 Index tomorrow AM. Have a great day.
By David Petch
http://www.treasurechests.info
The main focus of my work pertains to analysis of the USD index, S&P 500 Index, 10 Year US Treasury Index, AMEX Gold BUGS Index and the AMEX Oil Index using market analysis specified in a former article I wrote titled “The Technical Palette” (Elliott Wave, Bollinger bands, stochastics). We also cover around 30-40 gold/silver, base metal and energy stocks, which have done quite well recently. If this is the kind of analysis you are looking for, we invite you to visit our new and improved web site and discover more about how our service can further aid you in achieving your financial goals. For your information, our new site includes such improvements as automated subscriptions, improvements to trend identifying / professionally annotated charts, to the more detailed quote pages exclusively designed for independent investors who like to stay on top of things. Here, in addition to improving our advisory service, our aim is to also provide a resource center, one where you have access to well presented 'key' information concerning the markets we cover. And if you have any questions, comments, or criticisms regarding the above, please feel free to drop us a line . We very much enjoy hearing from you on these matters.
Copyright © 2007 treasurechests.info Inc. All rights reserved.
Unless otherwise indicated, all materials on these pages are copyrighted by treasurechests.info Inc. No part of these pages, either text or image may be used for any purpose other than personal use. Therefore, reproduction, modification, storage in a retrieval system or retransmission, in any form or by any means, electronic, mechanical or otherwise, for reasons other than personal use, is strictly prohibited without prior written permission.
Disclaimer: The above is a matter of opinion and is not intended as investment advice. Information and analysis above are derived from sources and utilizing methods believed reliable, but we cannot accept responsibility for any trading losses you may incur as a result of this analysis. Comments within the text should not be construed as specific recommendations to buy or sell securities. Individuals should consult with their broker and personal financial advisors before engaging in any trading activities as we are not registered brokers or advisors. Certain statements included herein may constitute "forward-looking statements" with the meaning of certain securities legislative measures. Such forward-looking statements involve known and unknown risks, uncertainties and other factors that may cause the actual results, performance or achievements of the above mentioned companies, and / or industry results, to be materially different from any future results, performance or achievements expressed or implied by such forward-looking statements. Do your own due diligence.
© 2005-2022 http://www.MarketOracle.co.uk - The Market Oracle is a FREE Daily Financial Markets Analysis & Forecasting online publication.


