


Gold Breaks to the Upside Following Confusing Manipulated Price Action
Commodities / Gold & Silver 2009 Mar 22, 2009 - 06:47 AM GMTBy: Merv_Burak

 We've had a couple of very interesting days in the gold market this past week but in the end the up side prevailed. I'm not sure if gold is being manipulated or if the major speculators who have the money to move prices are just confused and don't know which way to go. I'll just stick to the market action.
GOLD : LONG TERM
Nothing much has changed in the long term P&F chart shown last week except for the addition of two additional X's on the up side. The bull market continues as far as the P&F chart is concerned.
As for the usual indicators, they are also all still looking good. Gold remains above its positive sloping long term moving average line. The momentum indicator remains in its positive zone and is once more above its positive trigger line. As for the volume indicator, it has not yet recovered from the sharp drop in late February. It is moving sideways now but remains below its negative sloping trigger line. Still, putting it all together the long term rating remains BULLISH .
INTERMEDIATE TERM
On the intermediate term things are still going just fine. Although it might seem that gold closed below that up trend line it all depends upon which numbers one uses. I use the Closing Price from the NYMEX while most data vendors provide the Settlement Price. The two are usually very close but on occasion they could differ significantly. Wednesday was just such a day. The Settlement price closed well below the $900 level while the Last price closed well above (at $942). Things got together the next day but it would have made a significant difference in market analysis for the daily action depending upon which price one used on Wednesday evening.
There are many ways of gauging the market position for whatever time period one is considering. Among the simplest is the interaction between two moving average lines, a shorter and a longer one. The MACD indicator is one such indicator. For the intermediate term one could do a lot worse than viewing how the short term (15 DMAw) relates to the intermediate term (65 DMAw). I use the weighted averages. One could get similar results by using the simple 10 DMA and 50 DMA. As long as the 15 DMAw is above the 65 DMAw then all is okay from the intermediate term. If the 15 DMAw is below the 65 DMAw then all is not okay from the intermediate term. Yes, there are times that they will cross and a few days later cross again for a whip-saw effect but nothing is perfect. We see on the short term chart that the 15 DMAw is still above the 65 DMAw so all is still a-okay. Just a quickie note, I usually take a crossing of the averages as a warning and not panic until the longer term average (in this case the 65 DMAw) changes direction. The two actions are usually close together.
Gold weathered the storm of early Wednesday and is once more moving higher, although it has a little to go before it exceeds its high from a few weeks back. It is still above its intermediate term positive sloping moving average line. The momentum indicator remains in its positive zone and is above its positive trigger line. The volume indicator is the weak link as it is below its negative trigger line. However, the rating is still BULLISH on the intermediate term.
SHORT TERM
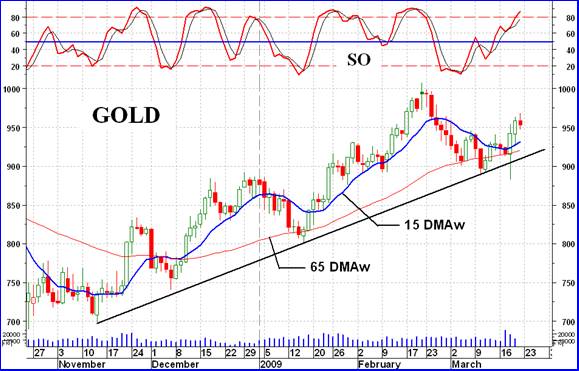
The aggressive Stochastic Oscillator (5 %K, 3 Slow & 3%D) is usually quite good at giving turning points in the price although it is very sensitive and the turns are often very short lived. Still it's good to have as a warning device. The reaction of the past few weeks seems to be over and the short term direction is once more to the up side. Gold is once more above its short term moving average line and the line has turned upwards. The Stochastic Oscillator (SO) is zooming upwards and has entered its overbought zone. Now to watch out for a turn around here with a cross below its trigger line. For now it is still positive. The short term is BULLISH with the direction of least resistance still to the up side although this needs to be closely watched for a reversal.
SILVER
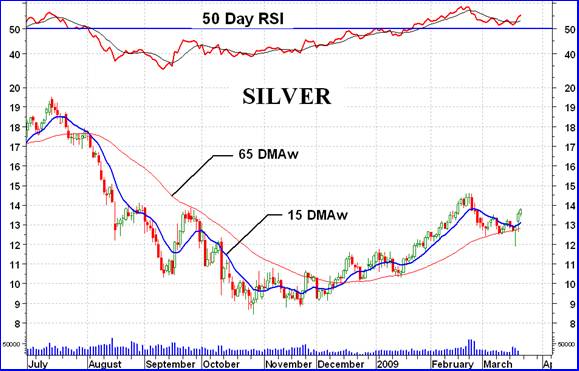
Silver is continuing its “handle” part of the saucer pattern (mentioned last week). It should finish the handle and get on with the rally very soon. In the mean time the intermediate term action here is very similar to that of gold with the momentum and moving averages. Both the silver price and the short term moving average are above the intermediate term moving average line. The short term average line has also just turned back to the up side. We should see a continuation of the up side move although that SO is suggesting that we should be prepared for a rest or reaction soon. When it comes it should be short lived as the SO is a short term indicator. We need the longer term indicators to confirm any turn for such turn to be something more than short term.
Precious Metal Stocks
That was some week for the stocks. Stock Indices in the double digit zone and stocks just zooming into the stratosphere. It can't last but we love it while we got it. In the 160 stocks in the Merv's universe there were 130 stocks closing the week on the up side and 30 on the down side. With the action during the week I'm surprised there were that many on the down side. It just seemed like everything was moving higher.
Using my daily table of technical information and ratings shows the summation of ratings to be positive for all three time periods and is interesting. The ratings are for the short term, BULL 84%, BEAR 13%; for the intermediate term BULL 79%, BEAR 17% and for the long term BULL 59%, BEAR 28%. The short term seems to be using up all of its short term bullishness and leaving little room for more. It just may be topping for a while. The intermediate term still has some room for growth but also lots of room for a reaction should the short term reverse. The long term moves very slowly and has a lot of room for upside growth.
Silver stocks seem to be the ones that are continuing to move and the higher quality stocks are moving the most. A 20.6% move in the Qual-Silver Index was the result of three stocks averaging well into the 30% move range.
Merv's Precious Metals Indices Table
Well, that's it another week.
By Merv Burak, CMT
Hudson Aero/Systems Inc.
Technical Information Group
for Merv's Precious Metals Central
For DAILY Uranium stock commentary and WEEKLY Uranium market update check out my new Technically Uranium with Merv blog at http://techuranium.blogspot.com .
During the day Merv practices his engineering profession as a Consulting Aerospace Engineer. Once the sun goes down and night descends upon the earth Merv dons his other hat as a Chartered Market Technician ( CMT ) and tries to decipher what's going on in the securities markets. As an underground surveyor in the gold mines of Canada 's Northwest Territories in his youth, Merv has a soft spot for the gold industry and has developed several Gold Indices reflecting different aspects of the industry. As a basically lazy individual Merv's driving focus is to KEEP IT SIMPLE .
To find out more about Merv's various Gold Indices and component stocks, please visit http://preciousmetalscentral.com . There you will find samples of the Indices and their component stocks plus other publications of interest to gold investors.
Before you invest, Always check your market timing with a Qualified Professional Market Technician
Merv Burak Archive |
© 2005-2022 http://www.MarketOracle.co.uk - The Market Oracle is a FREE Daily Financial Markets Analysis & Forecasting online publication.