What Must Happens Before a New Stocks Bull Market Starts?
Stock-Markets / Stocks Bull Market Mar 20, 2009 - 01:15 PM GMTBy: Marty_Chenard

 It has probably been a few months since we last shared our Institutional Index chart with you.
Many of you know that following what Institutional Investors are doing is critically important for investors. With over 50% of all the daily volume coming from Institutional Investors each day, it makes them the "big guns" in the stock market. Going against them is always a bad idea ... if they are selling and you are buying, you will lose the game. (The Institutional Index is a compilation of the action of the "core holdings" owned by Institutional Investors and is posted daily on our paid subscriber site.)
Many investors are thinking that the market is done moving down and on the way up. Is "on the way up" supposed to mean that we are now starting a new Bull Market?
One thing for sure ... if the Institutional Index is not "on the way up", then the rest of the market is NOT going to be "on the way up" without them .
One thing I like about the Institutional core holdings index, is that it can't get manipulated. And because of that, technical analysis levels are usually "right on" ... just like in the old days.
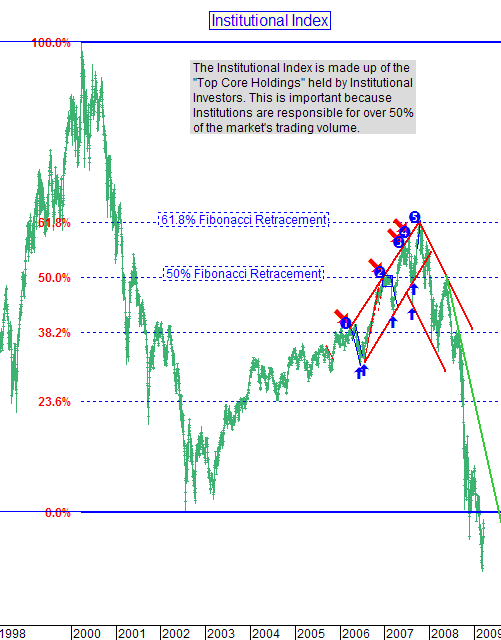
For instance, take the peak of the last Bull Market shown on the chart below. The day the Bull Market ended was an EXACT 61.8% Fibonacci retracement.
So, what is the Institutional Index showing us now?
It shows that very severe damage has been done to the stock market. Its recent low is the worse in a decade and its recent Bull Market high was only a 61.8% retracement of the dot-com bull market high.
More importantly, the Institutional Index shows no sign or confirmation of a new Bull Market rally starting. If fact, the index has not even reached its Bear Market resistance line shown in green.
Before a new Bull Market happens, the index will need to challenge the resistance line, break through it, survive a retest of the lows of at least the 2002 lows, and start to making higher/highs and higher/lows. This is all part of a healthy bottoming process, and we are NOT going to skip all those steps.

________________________________________________
*** Feel free to share this page with others by using the "Send this Page to a Friend" link below.
By Marty Chenard
http://www.stocktiming.com/
Please Note: We do not issue Buy or Sell timing recommendations on these Free daily update pages . I hope you understand, that in fairness, our Buy/Sell recommendations and advanced market Models are only available to our paid subscribers on a password required basis. Membership information
Marty Chenard is the Author and Teacher of two Seminar Courses on "Advanced Technical Analysis Investing", Mr. Chenard has been investing for over 30 years. In 2001 when the NASDAQ dropped 24.5%, his personal investment performance for the year was a gain of 57.428%. He is an Advanced Stock Market Technical Analyst that has developed his own proprietary analytical tools. As a result, he was out of the market two weeks before the 1987 Crash in the most recent Bear Market he faxed his Members in March 2000 telling them all to SELL. He is an advanced technical analyst and not an investment advisor, nor a securities broker.
Marty Chenard Archive |
© 2005-2022 http://www.MarketOracle.co.uk - The Market Oracle is a FREE Daily Financial Markets Analysis & Forecasting online publication.


