Some Signs of a Trend Reversal from Stocks Bear to Bull
Stock-Markets / Stocks Bull Market Mar 20, 2009 - 05:58 AM GMTBy: Richard_Shaw
 We think these would be some important signs of a major, sustainable trend reversal:
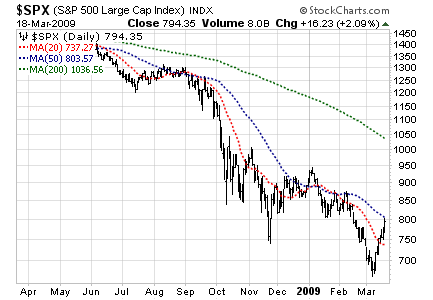
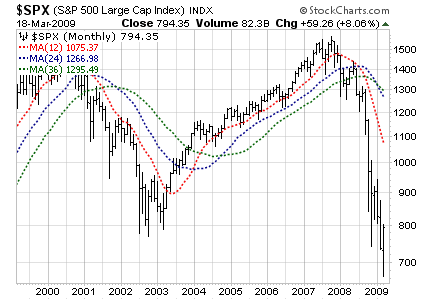
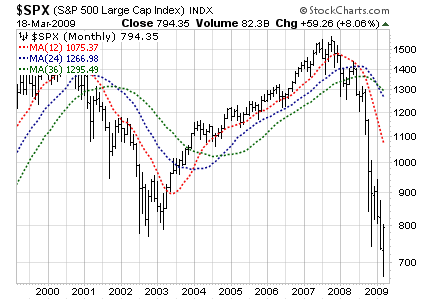
1. Visual clues to trend reversal (price chart and multiple moving averages pointing up). That has not yet happened.
S&P 500 Daily for 1 Year
S&P 500 Weekly for 3 Years
S&P 500 Monthly for 10 Years
2. An end to the legislative and rescue package “house on fire” activity, announcements and actions by the US President, Legislature, Treasury and Federal Reserve. That hasn't happened yet. Every new rescue program simply reveals deeper and perhaps longer lasting fundamental problems. Uncertainty abounds. Uncertainty is not good for stock prices.
Wall Street Journal (March 19) … The Fed had already cut its benchmark interest-rate target to near zero. Unable to go lower, the central bank now is essentially printing money to raise the supply of credit …
3. Resolution as to whether General Motors will file for bankruptcy or be supported with US taxpayer investments. That hasn't happened yet. GM in bankruptcy could be a game changer, and is an important uncertainty element.
4. An end to worrisome statements about GDP and rescue actions by China, Japan, UK, the European Central Bank, and the IMF. That hasn't happened yet.
Bloomberg (March 13) … China's Premier Wen Jiabao said he's concerned about the safety of its investment in U.S. government debt.
Reuters (March 19) “Even in countries where banking sectors still appear resilient, the deepening global financial crisis is likely to imply greater stresses,” said an IMF paper prepared for G20 finance ministers who met last weekend near London. … “Measures have not stemmed the market-driven deleveraging process, and lending surveys point to a continued deterioration for the next year in the United States, Europe, Canada and Japan,” the IMF paper said.
5. Signs of evolving stability in the US housing market — an important proxy for household wealth. Maybe we have small signs here and there, but they are inconclusive. We may also have a credit card bust coming up for major banks in the near future as a trailer to the housing bust (reference American Express, actually compensating customers to payoff and close their credit accounts).
Bloomberg (March 17) — U.S. housing starts in February unexpectedly snapped the longest streak of declines in 18 years, raising optimism the market may be finally finding a floor. … “It's a bit too early to get too excited, but we are nearing the bottom in housing,” said Scott Anderson, senior economist at Wells Fargo & Co. in Minneapolis…
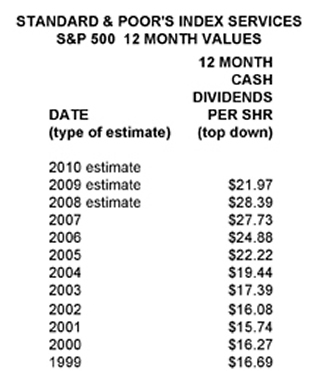
6. Apparent end of dividend cuts by major companies. Cuts are still coming out. It would be good to make a quarter with only normal cuts and few if any cuts by former stalwarts of long-term dividend payment. We're not there yet.
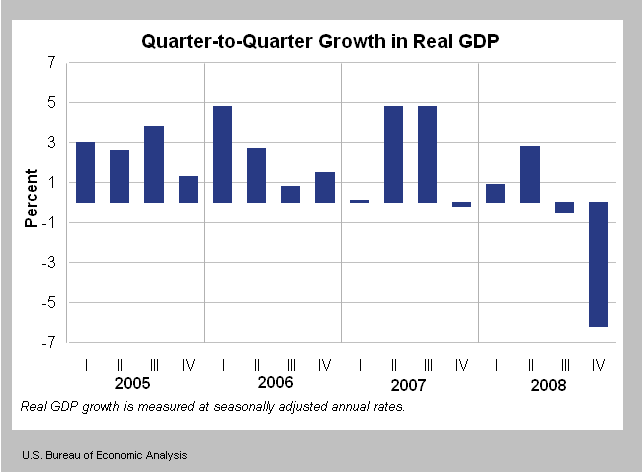
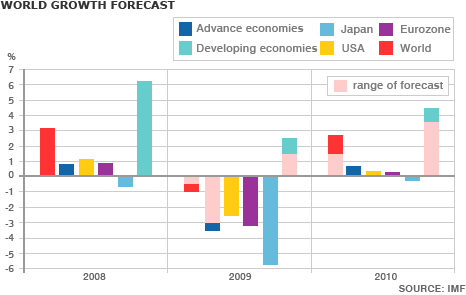
7. GDP showing positive rather than negative growth. IMF and other growth estimate sources show negative global growth, and growth so slowed in China that they are subject to social upheaval. The US, EU and Japan have 2009 GDP growth projections of -2.3%, -3.0% and -5.8% respectively, according to The Kiplinger Letter; and China and India have reduced GDP growth expectations at 6% and 5% respectively. None of those growth rates are supportive of a bull market.
Wall Street Journal (March 19) The World Bank … cautioned that China should be prudent about expanding its stimulus this year as it may need to save its ammunition for 2010.
US GDP Growth
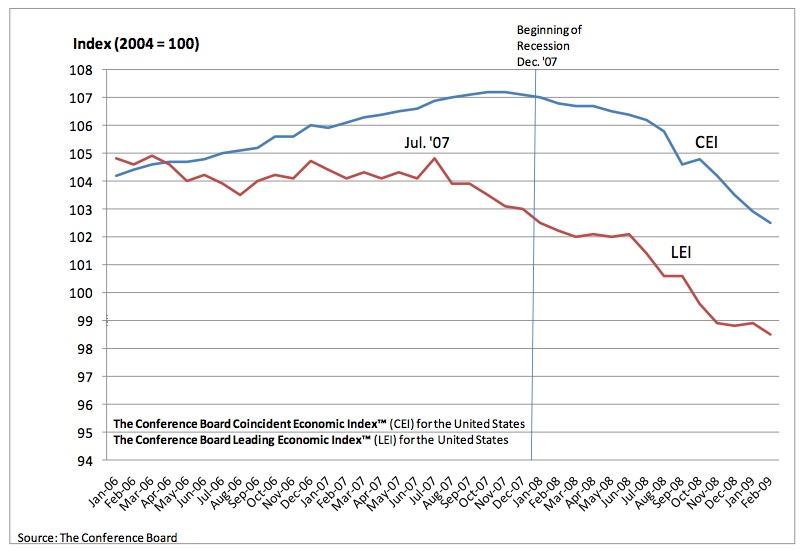
Coincident and Leading Economic Indicators
BBC (March 19) The world economy is set to shrink by between 0.5% and 1.0% in 2009, the first global contraction in 60 years. … In its gloomiest forecast yet, the International Monetary Fund (IMF) says that developed countries will suffer “deep recession” .
IMF Global GDP Projections
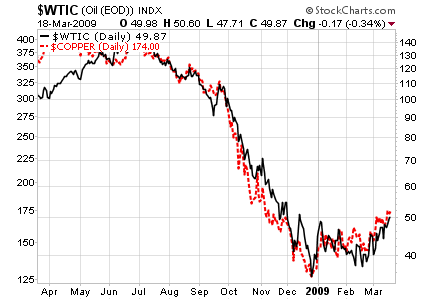
8. Key industrial input resources, such as oil and copper, rising. In that we have encouraging signs. That's a positive note.
[ We think owning physical oil in royalty trusts is a reasonable thing to do at this time for those who intend to have a commodities allocation. ]
Oil and Copper Prices Daily for 1 Year
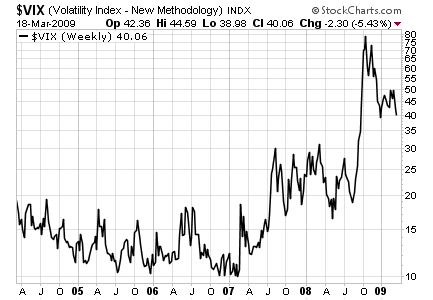
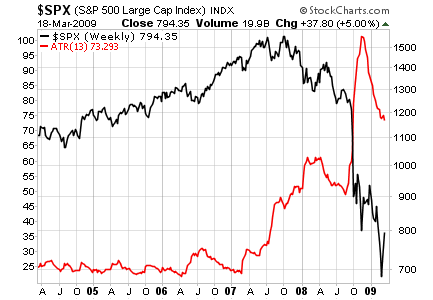
9. Risk levels in terms of price volatility or the VIX (options volatility index) should calm down to more normal levels. Some say that 40 is the new 20 for the VIX, but that sounds too much like “new paradigm” to us. Alleged new paradigms are often traps. We'd like to see the VIX and the S&P 500 Average True Range of prices decline to pre-crash levels.
VIX Weekly for 5 Years
S&P 500 and S&P 500 Average True Range Weekly for 5 Years
10. Fundamental valuation multiples should come into normal ranges for a negative economic environment, based on declining near-term projected “as reported” earnings, not on near-term projected core operating earnings excluding write-downs, discontinued operations, layoff costs, litigation, and other “non-recurring items” ( See our most recent article on valuation .)
S&P 500 Earnings History and Projections
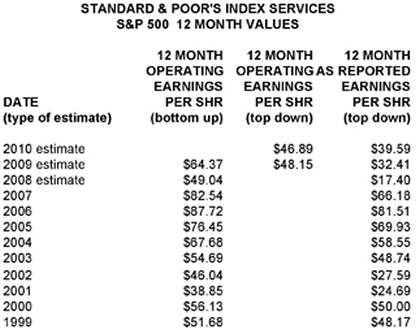
The current S&P 500 P/E multiple is about 24 times 2009 estimated “as reported” earnings, and about 20 times estimated 2010 “as reported” earnings. That is too high. “Normal” is more like 15, and 10 is more typical of the depths of a bear market. Stocks are still expensive.
By Richard Shaw
http://www.qvmgroup.com
Richard Shaw leads the QVM team as President of QVM Group. Richard has extensive investment industry experience including serving on the board of directors of two large investment management companies, including Aberdeen Asset Management (listed London Stock Exchange) and as a charter investor and director of Lending Tree ( download short professional profile ). He provides portfolio design and management services to individual and corporate clients. He also edits the QVM investment blog. His writings are generally republished by SeekingAlpha and Reuters and are linked to sites such as Kiplinger and Yahoo Finance and other sites. He is a 1970 graduate of Dartmouth College.
Copyright 2006-2009 by QVM Group LLC All rights reserved.
Disclaimer: The above is a matter of opinion and is not intended as investment advice. Information and analysis above are derived from sources and utilizing methods believed reliable, but we cannot accept responsibility for any trading losses you may incur as a result of this analysis. Do your own due diligence.
Richard Shaw Archive |
© 2005-2022 http://www.MarketOracle.co.uk - The Market Oracle is a FREE Daily Financial Markets Analysis & Forecasting online publication.


