Stock Market Investing Buy and Hold vs. The Right Time to Buy
Stock-Markets / Stocks Bear Market Mar 19, 2009 - 12:50 PM GMTBy: Hans_Wagner

 Many investors were taught that buy and hold is the best investing strategy. None other than Professor Jeremy Siegel author of Stocks for the Long Run, 4th Edition: The Definitive Guide to Financial Market Returns And Long Term Investment Strategies is a strong proponent of the buy and hold approach support this method. In a recent editorial in the Wall Street Journal, stating that stocks were cheap now and investors should buy. With the DJIA at lows not seen since 1997, it has been very tough for the buy and hold crowd. Could you have done better by timing your entries and exits?
Buy and Hold
Crestmont Research provides an excellent tool to measure the stock market returns over any time period that began in 1901 and ended in 2008. Called the Stock Matrix is provides a useful measure of the compound annual returns the market over any time period. For example, from 1997 through 2008 an individual taxpayer's compound annual return would have been minus two percent. The compound annual return starting in 1987 through 2008 is two percent. I encourage you to take some time and review the chart at Crestmont, as Ed Esterling does a great job in the analysis. You would have done better in a bank savings account.
It is interesting to see on the Stock Matrix chart that the best an investor could do by exiting in 2008 was to have invested in 1982. This would have generated a four percent compound annual return. The returns generated by exiting in 2008 and entering in 1998 through 2008 are all negative. Not very surprising. Hardly a good sign for the buy and hold crowd.
The proponents of buy and hold told us to expect eight, 10, and even 12 to 15 percent returns on our money, depending which financial “sales person” was quoted. I suspect and hope that most of these sales people are no longer employed espousing their untruths.
Timing Your Entry and Exit
What if you held a twenty-year position that began in 1982 and you had been able to exit your long positions in 2001, a year after the beginning of the bear market of 2000. Again, looking at the Stock Matrix from Crestmont Research, your return would have been a compound average of 7 percent. At least, that is a better return and beats holding your cash in a low interest bank account.
The bear market of 2000 ended in 2002, as the market rose from there to the end of 2007. Again, what if you had been fully invested in the S&P 500 from 2003, after the last bull market began, and you were able to close out at the end of 2007, when the latest bear market began. In that case, your compounded return would have been 7 percent. Another nice return for holding the S&P 500.
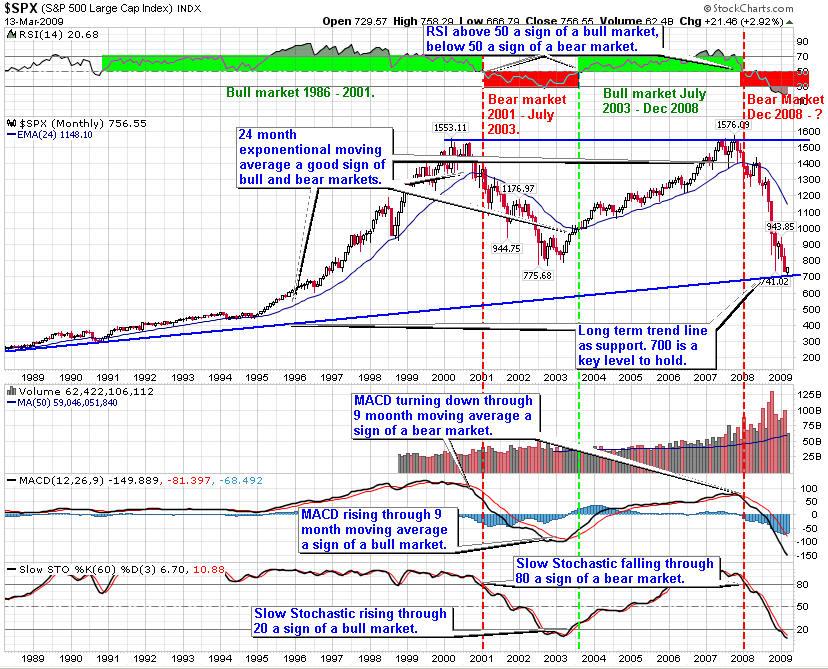
Of course, hindsight is a wonderful thing. It is easy to look back and do this kind of what if's and show how an investor could do well. On the other hand, by just following the buy and sell signs on the monthly chart of the S&P 500 below, an investor could have received very similar returns by just owning one of the S&P ETFs.

Since we are in a severe bear market, a time will come when it will be good to be long based on the monthly chart. Looking at the chart above, that time is still a number of months away.
The Bottom Line
The point of this article is that you can increase your returns by following well-founded indicators to help you time your buys and sells. Of course, you should not expect to be perfect in the timing of your buy and sells. However, using the right indicators can go a long way to improving the odds in your favor. After all the reason we invest is to provide a secure financial future for our family and ourselves. We should employ every tool that works to assist us in that goal.
By Hans Wagner
tradingonlinemarkets.com
My Name is Hans Wagner and as a long time investor, I was fortunate to retire at 55. I believe you can employ simple investment principles to find and evaluate companies before committing one's hard earned money. Recently, after my children and their friends graduated from college, I found my self helping them to learn about the stock market and investing in stocks. As a result I created a website that provides a growing set of information on many investing topics along with sample portfolios that consistently beat the market at http://www.tradingonlinemarkets.com/
Copyright © 2009 Hans Wagner
Hans Wagner Archive |
© 2005-2022 http://www.MarketOracle.co.uk - The Market Oracle is a FREE Daily Financial Markets Analysis & Forecasting online publication.


