


The Worst Stocks Bear Market Since the Great Depression
Stock-Markets / Stocks Bear Market Mar 08, 2009 - 10:30 AM GMT

 “Down, down, deeper and down”. So goes the chorus of a Status Quo song, but it is eerily starting to sound like the stock markets' anthem.
Another week and another plunge of equities on fears about the intensity of the global recession and renewed skepticism regarding the beleaguered financial sector. And, yet again, flight-to-safety trades such as the US dollar (at a three-year high) and government bonds took center stage.
Our family yesterday celebrated my son's eighth birthday. While the kids were amusing themselves in pirate garb, the parents engaged in a more subdued deliberation about the exhausting stream of ugly news on the financial front. Interestingly, never in a career of 26 years have I had so many people sympathizing with my “day job” as investment manager. Will the arrival of food parcels at my front door perhaps herald a bottom in the stock market?
Back to the past week's action on the markets. Globally, stocks were generally in the red, as summarized by the week's movements of the MSCI Global Index (-7.1%, YTD -24.2%) and the MSCI Emerging Markets Index (-2.2%, YTD -13.9%). As far as mature markets are concerned, European countries like Italy (+15.6%), Denmark (-11.7%), Belgium (-10.0%) and Holland (-9.2%) were on the receiving end of the selling orders.
The FTSE Eurofirst 300 Index touched the lowest level in its 12-year history, whereas the Japanese Nikkei 225 Average (-5.2%) came to within a stone's throw of a 26-year low.
But a few bourses also up put a good show, mostly among emerging markets. The Russian Trading System Index (+5.8%) and Chinese Shanghai Composite Index (+5.3%) brought some joy to investors, while Eastern European markets like Poland (+2.9%) and Romania (+2.3%) rebounded. (Click here to access a complete list of global stock market index movements, in local currency terms, as supplied by Emerginvest .)
As shown in the table below, the major US indices suffered another miserable week, recording eight losing weeks out of nine in 2009 and falling to 12-year lows. The Dow Jones Industrial Index's 2009 year-to-date decline of 24.5% is by far the worst start to a year after 44 trading days since 1900. According to Bespoke , there have been 19 previous years where the Dow was down 5% or more at this point, and only four of those years ultimately finished in positive territory.
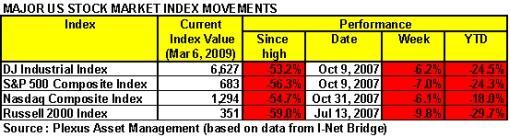
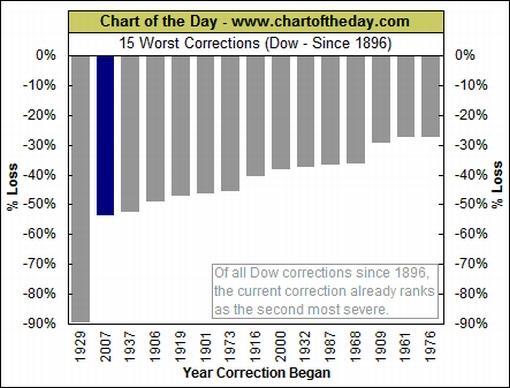
The Dow is currently down by 53.2% since its peak of October 2007. Chart of the Day points out that since 1896 only the bear market that started in 1929 has produced a larger slump.
On the exchange-traded fund (ETF) front, John Nyaradi ( Wall Street Sector Selector ) reports that “all things short” was again the theme of the week, with ProShares Short Financial (SEF) leading the way with a gain of 18.1%. Other inverse leaders were ProShares Short Russell 2000 (RWM) (+10.0%) and ProShares Short MidCap 400 (MYY) (+9.3%).
Among “long” ETFs the notable leaders were iShares MSCI Taiwan Index (EWT) (+5.0%) and US Oil (USO) (+3.5%).
Notwithstanding supply concerns, government bond yields in the US, UK and Germany declined as investors continued their flight to safety. Yields of 10-year Treasuries, Bunds and Gilts were down by 15, 58 and 20 basis points respectively.
In the case of the UK, the Bank of England introduced quantitative easing as its new monetary tool and unveiled an ambitious plan to buy UK government paper by printing money. Speculation rose that the Federal Reserve may also commence a program of buying longer-dated government securities. In typical David Fuller style, he offered the following advice to governments: “The patient is hemorrhaging on the operating table; do anything and everything to resuscitate (inflate) this deflating body.”
On the credit front, Markit 's spreads show that the cost of insuring corporate debt against default has increased markedly throughout the world over the past month. This is illustrated by the movement in the spreads (expressed in basis points) for the five-year credit derivative indices listed below.
• CDX (North America, investment-grade) Index: up from 196 to 250
• CDX (North America, high-yield) Index: up from 1,458 to 1,824
• Markit iTraxx Europe Index: up from 161 to 204
• Markit iTraxx Europe Crossover Index: up from 1,065 to 1,150
• Markit iTraxx Japan Index: up from 400 to 528
• Markit iTraxx Asia ex Japan IG Index: up from 363 to 462
• Markit iTraxx Asia ex Japan HY Index: up from 1,210 to 1,325
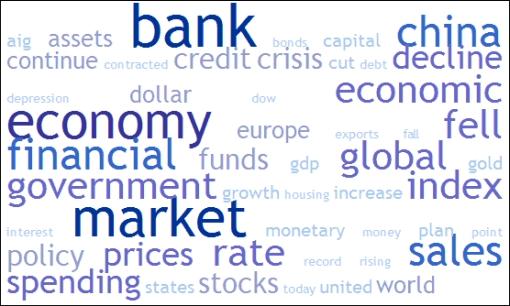
Next, a tag cloud of all the articles I have read during the past week. This is a way of visualizing word frequencies at a glance. Key words such as “banks”, “economy” and “markets” dominated the list, whereas “China” seems to be gaining more prominence by the week.
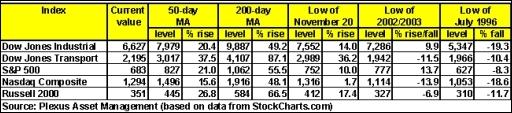
Having breached the November 20, 2008 and October 2002 lows, the Dow and S&P 500 have fallen significantly below their respective 50- and 200-day moving averages, as shown in the customary table summarizing important chart levels. The large deviations of the moving averages point to a massively oversold situation - almost like a spring that is stretched too far. Meanwhile, I have added the July 1996 lows to the table as these levels are now in sight of the indices.
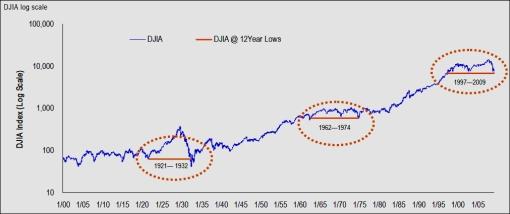
According to Thomas Lee, US Equity Strategist at JPMorgan, retracing 12-year lows for the Dow is an incredibly rare event (see chart below). “Besides the retest of 1997 lows seen on Monday, this has only happened two other times, on April 8, 1932, and December 6, 1974,” said Lee (via The Big Picture ). It is noteworthy that the 12-year low in 1932 was three months before the end of the bear market and the one in 1974 was exactly the low for that bear market.
Barry Ritholtz added: “Hitting a 12-year low is by no means proof the bear market is over. And, two prior examples do not make a sufficient sample. [But] the oversold nature of the market, as well as the virtual straight down drop that brought us here, does present a real possibility of a strong market rally.”
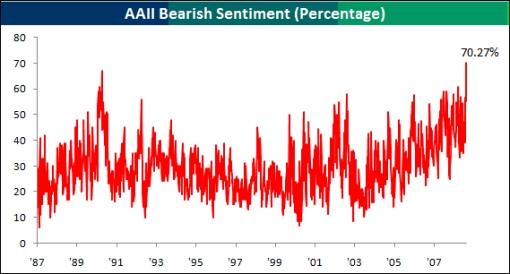
The precipitous stock market declines are reflected in the results of this week's survey of investor sentiment by the American Association of Individual Investors (AAII), courtesy of Bespoke . Investors are now at their most bearish levels since the start of the survey in 1987 with 70.27% of respondents currently in the bearish camp - a necessary prerequisite for a major market low.
James Montier, strategist of Société Générale , said (via FT Alphaville ): “We have long argued that the final stage of the de-bubbling process is revulsion. This phase is characterized by overwhelmingly cheap asset prices. Recent price moves in the UK and European stock markets have taken us to levels that have generally been associated with revulsion. Of course, cheap markets can always get cheaper, but for the long-term investor this may provide an excellent entry point.”
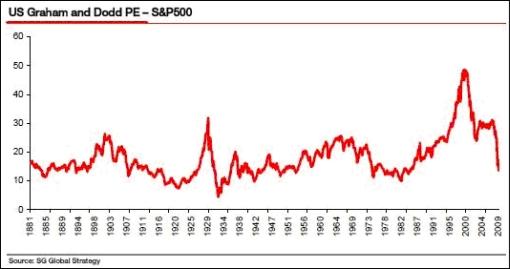
Montier's preferred valuation measure is the so-called Graham and Dodd price-earnings ratio that pitches the share price against a 10-year moving average of reported earnings. On this basis, the S&P 500 Index is currently trading at 13.6 compared with an average of 18 since 1871 and a typical “bargain basement” level of 10. (Keep in mind that this indicator dropped to 5 in the Great Depression.)
As usual, some interesting thoughts were also contributed by Richard Russell ( Dow Theory Letters ): “The stock market doesn't live in a vacuum. This huge decline in less than two years is telling us (me) something. It's a warning. I think it's a warning of very hard times to come, maybe as difficult as those times we saw during the Great Depression.
“I know that I stand pretty much alone with this scenario. I don't think most Americans see or even envision the potential danger ahead. They don't believe in the ‘truth of the stock market'. Over 60 years of studying the stock market and the economy, I've learned to believe the ‘language of the market'.
“I know that great bull markets and great bear markets tend to overrun at the extremes. Let me leave you with one thought - prepare for the extremes. Just as the bull market that ended in 2007 rose to the extremes, I believe this bear market will go to the extremes.”
At this juncture, short-term movements are almost impossible to predict, although the sell-off over the past few days - a capitulation in some respects - could nourish the long-awaited tradeable rally. Also, Lowry 's 90% down-days , like we experienced on Monday and Thursday, are often followed by two- to seven-day bounces. But we are not yet at the point where we leave the defeated bear's carcass behind, although each downward move brings us closer to the eventual bottom.
For more discussion about the direction of stock markets, also see my recent posts “ Video-o-rama: Gloomy investors shun risky trades “, “ Technical talk: Bounce not that impressive … “, “ Louise Yamada: Don't ‘venture into the waters' ” and “ Stock market performance round-up: Nowhere to hide “. (And do make a point of listening to Donald Coxe's weekly webcast, which can be accessed from the sidebar of the Investment Postcards site.)
Economy
“A pall continues to hang over global business confidence as it has since sentiment collapsed last fall. Confidence remains near a record low,” said the latest Survey of Business Confidence of the World conducted by Moody's Economy.com . “Most worrisome is the recent collapse in pricing power - a record over one-third of respondents now say they are cutting prices for their goods and services.”
Confidence is uniformly weak across all industries and regions of the globe, as highlighted in a recent Forbes article by Nouriel Roubini ( RGE Monitor ): “With economic activity contracting in 2009's first quarter at the same rate as in 2008's fourth quarter, a nasty U-shaped recession could turn into a more severe L-shaped near-depression (or stag-deflation).
“The scale and speed of synchronized global economic contraction are really unprecedented (at least since the Great Depression), with a free fall of GDP, income, consumption, industrial production, employment, exports, imports, residential investment and, more ominously, capital expenditures around the world. And now many emerging-market economies are on the verge of a fully-fledged financial crisis, starting with emerging Europe.”
The European Central Bank's growth projections for the Eurozone were significantly lowered from a range of -1.0% / 0.0% to a range of -3.2% / -2.2% for 2009, while for 2010 the range was revised from +0.5% / 1.5% to -0.7% / +0.7%, incorporating the possibility of an extended recession. As a result, the ECB lowered its refinance rate by 50 basis points to 1.50%, bringing its cumulative rate cuts to 275 basis points since mid-October 2008.
In an attempt to restore flagging confidence, the Bank of England also cut its target interest rates by 50 basis points to 0.5% and announced plans to start quantitative easing by printing money to purchase government bonds and other securities with an initial amount of £75 billion.
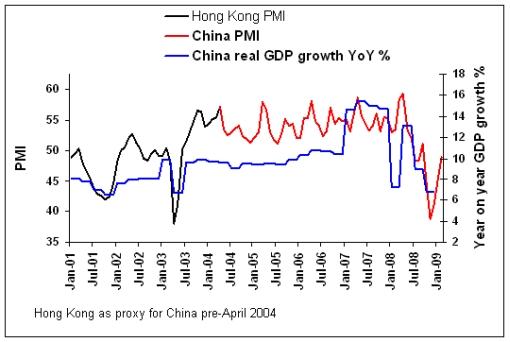
On a more positive note, China's manufacturing Purchasing Managers' Index (PMI) strengthened for a third consecutive month in February, climbing to 49.0% from 45.3% the previous month. As discussed in a recent post (” China - better days ahead “) and as shown in the graph below, China's improving PMI seems to indicate that the country might have seen the worst of its GDP growth statistics in this cycle. (The Hong Kong PMI is used as a proxy of the Chinese PMI prior to 2004.)
A snapshot of the week's US economic data is provided below. (Click on the dates to see Northern Trust 's assessment of the various data releases.)
March 06
• February employment report underscores severity of recession
March 5
• Productivity decline reflects GDP revision
• Factory inventories-sales ratio registers new high
• Jobless claims - decline is noteworthy but too early to identify as a turning point
March 3
• Bernanke hints more may be necessary and notes that “premature removal of fiscal stimulus could blunt recovery”
• Auto sales decline once again
• The decline of the Pending Home Sales Index suggests home sales remain under stress
March 2
• Consumer spending gains strength in January, but underlying fundamentals raise questions
• ISM Manufacturing Survey - insignificant gain in February
• Construction spending - non-residential and public components deteriorate more
• Affordability - silver lining of housing sector
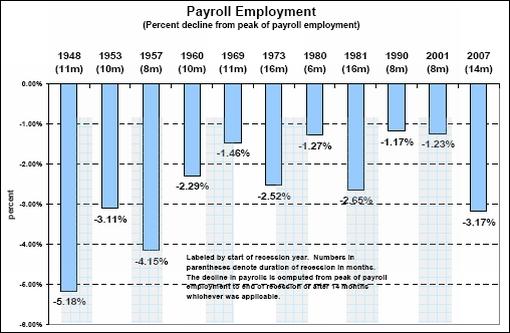
Commenting on the payroll employment data, Asha Bangalore ( Northern Trust ) said the statistics need to be evaluated within the context of the growth of the labor force. “The chart below takes into account the growth of the labor force and indicates the extent of job losses in each recession in the post-war period from the peak of payroll employment to the end of a recession. The 3.17% drop in payroll employment in the current recession of 14 months is the largest percentage drop in jobs since the 1957 recession.”
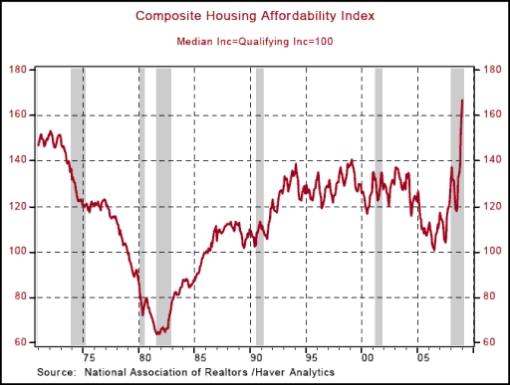
At the same time, Bangalore said there was a silver lining in the housing market that might have been overlooked. As shown in the chart below, the Housing Affordability Index of the National Association of Realtors shot up to a record high of 166.8 in January. Also, the Obama administration has made available details of the Homeowner Affordability and Stability Plan , which raises expectations of improvement in the housing market.
Week's economic reports
Click here for the week's economy in pictures, courtesy of Jake of EconomPic Data .
| Date | Time (ET) | Statistic | For | Actual | Briefing Forecast | Market Expects | Prior |
| Mar 2 | 8:30 AM | Personal Income | Jan | 0.4% | -0.2% | -0.2% | -0.2% |
| Mar 2 | 8:30 AM | Personal Spending | Jan | 0.6% | 0.4% | 0.4% | -1.0% |
| Mar 2 | 8:30 AM | Core PCE | Jan | 0.1% | 0.1% | 0.1% | 0.0% |
| Mar 2 | 10:00 AM | Construction Spending | Jan | -3.3% | -1.6% | -1.5% | -2.4% |
| Mar 2 | 10:00 AM | ISM Index | Feb | 35.8 | 33.5 | 33.8 | 35.6 |
| Mar 3 | 10:00 AM | Pending Home Sales | Jan | -7.7% | -3.5% | -3.5% | 4.8% |
| Mar 3 | 2:00 PM | Auto Sales | Feb | - | NA | NA | NA |
| Mar 3 | 2:00 PM | Truck Sales | Feb | - | NA | NA | NA |
| Mar 4 | 8:15 AM | ADP Employment Change | Feb | -697K | -580K | -630K | -522K |
| Mar 4 | 10:00 AM | ISM Services | Feb | 41.6 | 42.0 | 41.0 | 42.9 |
| Mar 4 | 2:00 PM | Fed Beige Book | - | - | NA | NA | - |
| Mar 5 | 8:30 AM | Productivity –Revised | Q4 | -0.4% | 1.1% | 1.0% | 3.2% |
| Mar 5 | 8:30 AM | Unit Labor Costs | Q4 | 5.7% | 3.4% | 3.8% | 1.8% |
| Mar 5 | 8:30 AM | Initial Claims | 02/28 | 639K | 650K | 650K | 670K |
Source: Yahoo Finance , March 6, 2009.
The US economic highlights for the week include the following:
Source: Northern Trust
Click here for a summary of Wachovia's weekly economic and financial commentary.
Markets
The performance chart obtained from the Wall Street Journal Online shows how different global markets performed during the past week.
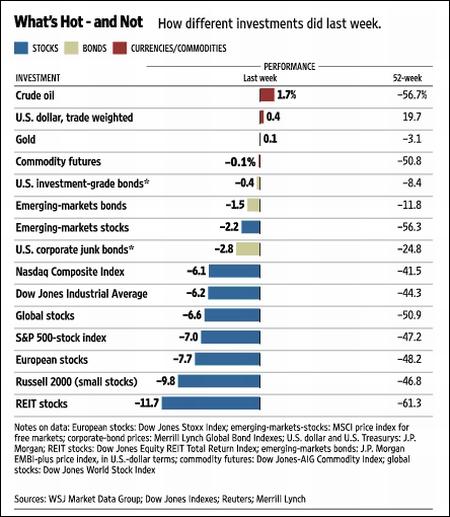
Source: Wall Street Journal Online , March 6, 2009.
“Every man has a right to his opinion, but no man has a right to be wrong in his facts,” said legendary investor Bernard Baruch . Hopefully the “Words from the Wise” reviews will assist Investment Postcards readers to get the facts right, and provide some fodder for formulating sensible opinions. But remember the golden rule: don't take investment decisions that will keep you from a good night's sleep.
That's the way it looks from Cape Town.
Dateline: Jim Rogers on the economy, markets
“George Negus speaks with Singapore-based financier, Wall Street veteran and former business partner of George Soros, Jim Rogers.”
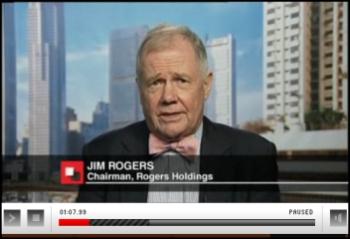
Source: Dateline , March 1, 2009.
Bloomberg: Jim Rogers - China stimulus can't pull world out of “hole”
“China cannot pull the world economy ‘out of the hole' through its stimulus spending alone and the global recession is not going to end anytime soon, investor Jim Rogers said.
“China's parliament convened today in its annual meeting in Beijing, where Premier Wen Jiabao reiterated the government's pledge to ‘significantly increase' investment in 2009 to help counter the slowest growth in seven years. He didn't announce any new stimulus spending.
“‘China can't solve the world's problems,' Rogers, the author of ‘A Bull in China: Investing Profitably In The World's Greatest Market', said in a phone interview today. ‘China is a wonderful and growing economy but it cannot pull the world out of the hole.'
“Wen's report to lawmakers, the equivalent of a US State of the Union speech, reiterated the country's 8% growth target. That's more optimistic than the International Monetary Fund's forecast that the nation's economy will expand 6.7%, the least in almost two decades.
“‘One question people keep asking is can China bring the whole world along out of this recession,' said Lee King Fuei, a Hong Kong-based portfolio manager at Schroder Investment Management, which oversees about $158 billion worldwide. ‘The fact that they're even asking this question tells me they're being unrealistic.'
“Rogers, chairman of Singapore-based Rogers Holdings, said he hasn't bought any Chinese stocks since November as valuations are not attractive.
“The Hang Seng China Enterprises Index, which tracks Chinese companies mostly traded in Hong Kong, is valued at 8.9 times reported earnings. Valuations fell to 7.4 times the week ended October 24, the lowest in almost seven years, according to Bloomberg data. The Shanghai Composite's 20% gain this year also made it the best performer among 91 benchmark indexes tracked by Bloomberg.
“‘I haven't bought any Chinese stocks since November and haven't sold anything either,' Rogers said. ‘I'm waiting for cheaper prices. I'm not buying Chinese shares at these levels.'
“Rogers added he remains ‘extremely bullish' on agriculture and that ‘commodities are the only sector in the world where the fundamentals are improving'.”
Source: Chua Kong Ho, Bloomberg , March 5, 2009.
Nouriel Roubini (Forbes): US financial system is effectively insolvent
“For those who argue that the rate of growth of economic activity is turning positive - that economies are contracting but at a slower rate than in the fourth quarter of 2008 - the latest data don't confirm this relative optimism. In 2008's fourth quarter, gross domestic product fell by about 6% in the US, 6% in the euro zone, 8% in Germany, 12% in Japan, 16% in Singapore and 20% in South Korea. So things are even more awful in Europe and Asia than in the US
“There is, in fact, a rising risk of a global L-shaped depression that would be even worse than the current, painful U-shaped global recession. Here's why:
“First, note that most indicators suggest that the second derivative of economic activity is still sharply negative in Europe and Japan and close to negative in the US and China. Some signals that the second derivative was turning positive for the US and China turned out to be fake starts. For the US, the Empire State and Philly Fed indexes of manufacturing are still in free fall; initial claims for unemployment benefits are up to scary levels, suggesting accelerating job losses; and January's sales increase is a fluke - more of a rebound from a very depressed December, after aggressive post-holiday sales, than a sustainable recovery.
“For China, the growth of credit is only driven by firms borrowing cheap to invest in higher-returning deposits, not to invest, and steel prices in China have resumed their sharp fall. The more scary data are those for trade flows in Asia, with exports falling by about 40% to 50% in Japan, Taiwan and Korea.
“Even correcting for the effect of the Chinese New Year, exports and imports are sharply down in China, with imports falling (-40%) more than exports. This is a scary signal, as Chinese imports are mostly raw materials and intermediate inputs. So while Chinese exports have fallen so far less than in the rest of Asia, they may fall much more sharply in the months ahead, as signaled by the free fall in imports.
“With economic activity contracting in 2009's first quarter at the same rate as in 2008's fourth quarter, a nasty U-shaped recession could turn into a more severe L-shaped near-depression (or stag-deflation). The scale and speed of synchronized global economic contraction is really unprecedented (at least since the Great Depression), with a free fall of GDP, income, consumption, industrial production, employment, exports, imports, residential investment and, more ominously, capital expenditures around the world. And now many emerging-market economies are on the verge of a fully fledged financial crisis, starting with emerging Europe.”
Click here for the full article.
Source: Nouriel Roubini, Forbes , March 5, 2009.
Did you enjoy this post? If so, click here to subscribe to updates to Investment Postcards from Cape Town by e-mail.
By Dr Prieur du Plessis
Dr Prieur du Plessis is an investment professional with 25 years' experience in investment research and portfolio management.
More than 1200 of his articles on investment-related topics have been published in various regular newspaper, journal and Internet columns (including his blog, Investment Postcards from Cape Town : www.investmentpostcards.com ). He has also published a book, Financial Basics: Investment.
Prieur is chairman and principal shareholder of South African-based Plexus Asset Management , which he founded in 1995. The group conducts investment management, investment consulting, private equity and real estate activities in South Africa and other African countries.
Plexus is the South African partner of John Mauldin , Dallas-based author of the popular Thoughts from the Frontline newsletter, and also has an exclusive licensing agreement with California-based Research Affiliates for managing and distributing its enhanced Fundamental Index™ methodology in the Pan-African area.
Prieur is 53 years old and live with his wife, television producer and presenter Isabel Verwey, and two children in Cape Town , South Africa . His leisure activities include long-distance running, traveling, reading and motor-cycling.
Copyright © 2009 by Prieur du Plessis - All rights reserved.
Disclaimer: The above is a matter of opinion and is not intended as investment advice. Information and analysis above are derived from sources and utilizing methods believed reliable, but we cannot accept responsibility for any trading losses you may incur as a result of this analysis. Do your own due diligence.
Prieur du Plessis Archive |
© 2005-2022 http://www.MarketOracle.co.uk - The Market Oracle is a FREE Daily Financial Markets Analysis & Forecasting online publication.