US Economy, Stuck in the Middle with You
Economics / US Economy May 05, 2007 - 07:06 PM GMTBy: John_Mauldin
Clowns to the left of me, Jokers to the right, here I am Stuck in the middle with you! - Stealers Wheel, 1974
The recent data on the economy is stronger than was expected. Does this mean that the slowdown we have seen for the past few quarters is behind us? Other data suggests the economy is weakening (witness the very slow 1.3% GDP growth last quarter). This week we look at the seeming disconnect in the data, briefly examine where the real stock market booms are happening, and re-visit the housing markets. It's a lot for what will be a quick letter (and lots of charts), as I am trying to leave town, so let's jump right in.
(And yes, I was supposed to finish a letter I started two weeks ago on black swans, but a technicality is holding up that letter. It will be resolved next week.)
Stuck in the Middle With You
The last few days have seen some positive news on the economic front. The national ISM data on manufacturing came in at a healthy 54.7, up from 50.9 last month and over 3 points above consensus expectations. The service sector index was an even healthier 56. Jobless claims dropped to 305,000. Unit labor costs were lower than expected while productivity was somewhat higher, which is good news on the inflation front.
Yet GDP was only up a dismal 1.3% last quarter, and many economists think it will continue to be weak this quarter, although the numbers above may cause some of them to move their targets up.
So, which is it? Have we seen the bottom in the economy or will the economy continue to soften as it has done for a year? It will come as no surprise that I am in the latter camp. But the above data highlights why I think we have a mild recession and not something more like the '80s when the housing market tanked.
The US economy is now about 80% services dependent. 70% of our economy is from consumer spending. The service sector and consumer spending are not going to be affected severely by the deep recession in housing and the contraction in manufacturing. While I expect consumer spending to soften over the next year, it will not go away, as most jobs are insulated from the two areas where employment is weak and going to get weaker. Plus, as we will see, a lot of the money in one weak sector (housing) was not being spent in the US in any event.
Let's first update some of the forward-looking charts which suggest we are facing the prospect of a recession. (Thanks to Hugh Moore at Guerite Advisors for updating the charts.)
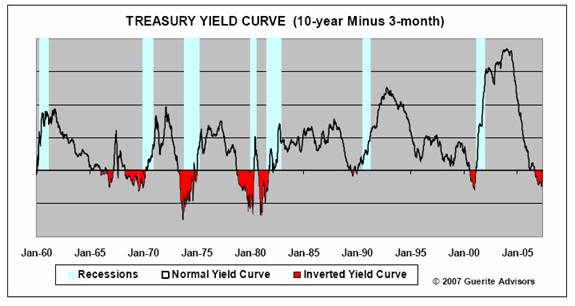
First, the yield curve is inverted. Notice that a recession has followed every time there has been an inverted yield curve. An inverted yield curve does not cause a recession, but signals that something is out of kilter in the US economy. So, when the yield curve starts signaling recession, you look around for what is wrong. As I have written, I think it is the US housing market (more on that below). By the way, this indicator would suggest that if there is a recession, it will be in the last half of 2007.
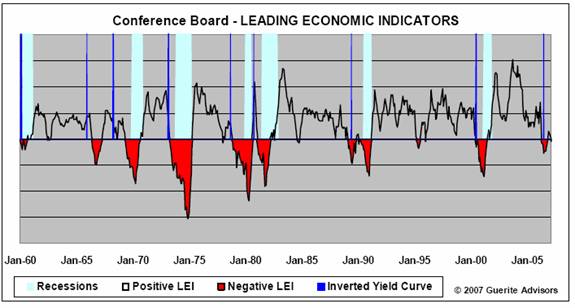
A less perfect predictor, but one with a good track record, is the index of Leading Economic Indicators. As I have written before, when the index has fallen for six months, we have had a recession in 7 out of the 10 occasions this has happened. The other three occasions, the drop was mild and there were significant slowdowns in the economy (but not outright recessions). This indicator would suggest a recession in the third quarter or so, and since the drop has not been that significant, it would suggest a mild recession as well.
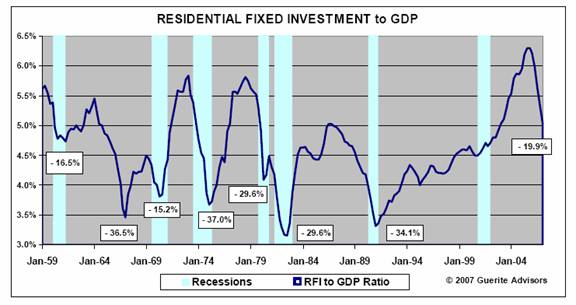
Yet another reasonably good indicator of the future direction of the economy is the ratio of residential fixed investment to GDP. This makes sense, as home building is an important part of the economy. Notice that when there has been a 20% decline from the peak in the ratio, a recession followed in all but one instance (in the mid-'60s). You will also see that there was no drop before the last recession. Not a perfect record, but something to which attention must be paid. And as we will see below, there is good reason to expect that ratio to drop much more. Hugh thinks this chart suggests a mid to late 2007 onset of a recession.
Follow the Undocumented Money
Earlier I suggested that the drop in housing construction employment may not have as much of an impact on consumer spending as you might think. This is because much of the housing payroll is sent south to Latin America and spent there. (I have read several stories the past few weeks on this, but a good summary was done by The Liscio Report, from which I get most of the facts. www.theliscioreport.com )
A study by the Pew Hispanic Center highlights an interesting set of facts, and I think may also give us an idea as to why the unemployment index has not risen.
"According to Pew, our 19.6 million Hispanic workers constitute 13.6% of total employment. In 2006 Hispanic employment was up by about 1 million, or 36.7% of the nationwide employment increase of 2.7 million. In the construction sector, Hispanic workers, mostly foreign born, garnered two-thirds of the 550,000 new jobs created in 2006. Our 2.9 million Hispanic construction workers held 25% of our 11.8 million construction jobs in 2006, and 2.2 million of those workers were foreign-born, many recent arrivals at that." (TLR)
There has been a significant gap between the Non-Farm Payrolls (NFP) and the Household Survey, with the NFP having to be adjusted upward to account for a very strong Household Survey. TLR speculates (and with good reason) that part of the anomaly may be caused by these foreign-born workers, many (though not all) of them undocumented. But they are also not on the official rolls as unemployed, so when they lose their jobs they do not count toward unemployment. Lately, we have seen the gap between the two estimates of employment close.
There is reason to believe the drop in employment among foreign-born workers is severe. Lately there has been a large fall-off in the growth of the amount of money sent back home to Mexico. It rose a stunning 23% a year between 2000 and 2006. Banco de Mexico data through February of 2007 shows it dropping 26% from the peak last May of 2006. This suggests that the recent drop of 27,000 residential construction jobs in the BLS data does not reflect the true picture.
How large is that? Latin America had $62 billion in remittances, with 75% coming from the US, or about $45 billion. There are some Latin American countries that have issued bonds based upon that cash inflow, not realizing that they were subject to a crunch in the US housing market. Not quite the subprime debacle, but an interesting unintended consequence.
On a sidebar, the Bush administration has been sending press releases about how illegal immigration is down by 10%. Just a thought, but maybe it is the lack of employment opportunity that is just as responsible.
The Further Decline in Housing
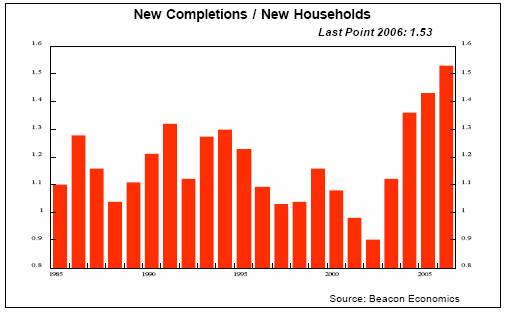
I think that these remittances are sadly going to decline further, because the drop in housing-related construction is far from its bottom. A recent analysis by Gary Shilling gives us some very uncomfortable facts. Gary estimates that there are over 2,000,000 excess homes (in terms of what is actually needed for everyone to have a home), far above the norm. Let's look at some graphs from his latest letter. Basically, as new families are created you have to find them a place to live, so long-term home building is a growing business. But homebuilders respond to the markets, so sometimes they build fewer homes than are needed and sometimes more. In theory, you would like the ratio of new homes to new households to balance. Notice in the chart below the ratio was low (less than 1.1) for much of the late '90s and early part of this decade, even as the percentage of homeowners grew. That demand spurred homebuilders, and the ratio shot up to all-time highs for the last three years.
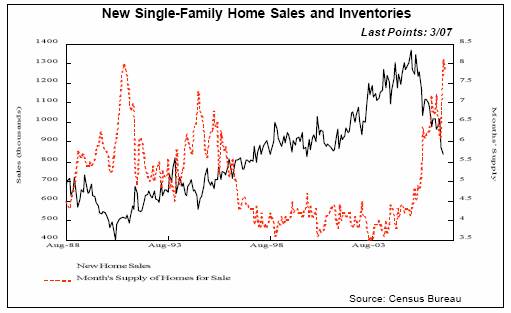
Now, houses that are vacant are at an all-time high. The chart below shows that even while new home sales are dropping (black solid line), the inventories are rising to an 8-month supply (red dotted line). Shilling estimates that as foreclosures and homes that were bought by speculators and now are not selling come back onto the market, the number of months of inventory may jump to as high as 11.
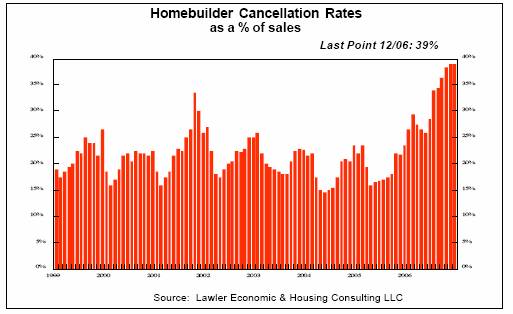
Look at the homebuilder cancellation rates, which are at all-time highs, even as builders are offering more incentives:
This all means that it is going to take several years to work through the excess inventory, putting more pressure on home prices. While I am not as pessimistic as Gary - but then few people are (just kidding, Gary) - I do expect this is going to be a drag on the economy for at least a year, slowing any recovery from a recession later this year or early next year.
Think back to the chart showing the ratio of residential fixed investment to GDP. Notice that a drop of 30% is quite normal. Given that there is a large glut of homes for sale and that number is likely to increase, the number of new homes built is going to continue to drop from an annualized high of about 2.2 million in January of 2006 (and an actual 1.8 million in 2006) to about 1.6 million this year and 1.5 million next year. If the subprime woes push too many homes back on the market, these numbers could be optimistic. Gary thinks housing starts could fall as low as 1 million in 2008. If he is right, I am way too optimistic about there only being a mild recession.
In any event, housing market declines always look like a slow-moving train wreck. Homeowners that want or need to sell (say for a job-related move) think their home is special and "don't want to give it away." It takes time for people to adjust to a new reality when there is not a market-clearing exchange that readily tells them the price of their house. It takes a long time for a loan to go into default, then foreclosure, and finally onto the market. This is a process that will take years, not a few quarters. Remember your young kids asking on road trips when are we going to get there? We are only half-way "there," and have a long way to go before we see the bottom.
Remember that we are seeing a large number of loans "re-set" their payments this year and next, pushing the payments beyond the ability of the homeowner to make them. The housing market is going to affect consumer spending a lot more than just the losses from construction jobs.
For this and a host or reasons I have written about in previous letters, I think we are still on a path to recession. Clearly the market does not. As I write this on Thursday afternoon, the market has set yet another all-time high.
A Market Melt-Up?
As Barry Ritholtz writes, "The markets are presenting us with a contradiction: They are accelerating to the upside as the economy is decelerating to the downside. We suspect we are witnessing a melt up of sorts, where high risk traders have created a dangerous air pocket as they take the markets ever higher."
You can look at the source of trades and it seems evident that the public is not yet massively involved, witness that the volume from online brokers is not high. When and if they do get involved, it could lead to Barry's "melt-up," as there are an unusually high number of shorts that could get taken out. Dow 14,000 is just 5% away. Is that the pilot coming over the speaker telling us to fasten our seatbelts as an air pocket or two is in front of us?
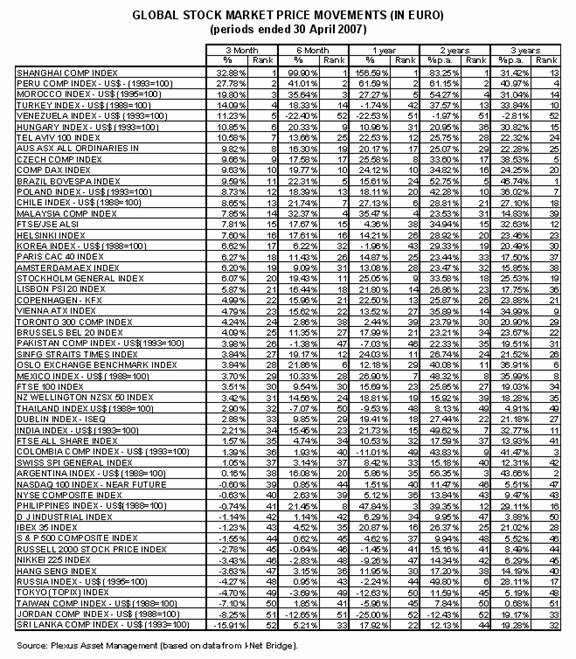
In the US, we think of the stock market as hot. If you are in the rest of the world, you may not be as impressed. My friend Prieur du Plessis of Plexus Asset Management in South Africa created the following chart for me. It ranks 52 stock market indices around the world in terms of how they have done for the last 3 months, 6 months and 1, 2, and 3-year periods, in euros. The Dow is number 50 over the last three years (only 3.88% a year for the last three years!) and in negative territory for the last three months. Only one stock -- market, Venezuela, has been down over the last three years. (And deservedly so as their president is doing his best to destroy their economy. I feel for the people, as his policies will ruin what by all rights should be a prosperous nation.)
Take a look at the chart of the various markets in terms of euros below. By the way, in dollar terms, the Dow is still #50 at three years and there are no stock markets with losses over three years. The Dow is only 42 over the last three months in dollar terms, so it is no wonder that we are seeing massive money flows to international markets.
China is #1 for most periods (no surprise). If you live in Europe, think about where you would be putting your money. Probably not in the US markets.
Massive Reserve Liquidity
Finally, and quickly, a statistic that I find interesting. Dennis Gartman called my attention to an IMF report showing the growth of foreign exchange reserves held by the various nations reporting to the IMF. They have grown from a "mere" $2 trillion in 2000 until they are now over $5 trillion and rising. The report suggests that this does not include 40% of the "reserves" which are not accounted for, so the number is much higher.
This is going to unleash a large amount of capital back into the markets. Countries, in one sense, are just like families. They hopefully save money. The first savings are generally in very liquid investments in case there is an emergency. But over time, as savings grow, they start to invest in less liquid investments and soon in long-term investments.
China recently noticed that perhaps $1 trillion in liquid reserves is maybe more than they need in spare cash laying around the house. They suggest they may take up to 30% of this and invest it, much as Singapore, Dubai, or Norway do now. This is going to be a growing trend. This will be good for the world in general, as much of it will be for large longer-term projects that need deep pockets (like infrastructure). But it is also going to put even more capital into a world already awash with liquidity.
I am not certain of all the implications of this, but do find it something that needs to be put on the radar screen for further thought.
Scotland, Spain, Switzerland and Tulsa
I will be in Edinburgh, Scotland the last week of May, Barcelona and Madrid for the first weekend and Monday and Tuesday in June, then a quick flight to Malta and on to Geneva and Zurich the 6th, 7th and 8th of June. I will be available for meetings in Spain and Scotland (along with my partners Absolute Return Partners) and will be doing both private meetings and public events in Switzerland along with my Swiss partners EFG (Jerome Schonbachler is the contact there).
If you want to meet, drop me a note and I will forward it on and we will make it happen.
I am writing this letter a day early, as my daughter Amanda graduates from college tomorrow. One more down. It will be a fun road trip from Dallas, as four of my kids will ride up with me. Five hours go by fast if you laugh enough, although sitting in a car for five hours after moving last weekend is not what my back needs. Somehow, even if you hire a lot of help, a move seems to work your back over.
Have a great week. As a teaser, there are some projects I (and Tiffani) have been working on for a very long time that are getting close to being done, and that I think you will find interesting. I am looking forward to being able to tell you about them.
Your getting ready to watch Spiderman with his kids analyst,
By John Mauldin
Frontlinethoughts.com
Copyright 2007 John Mauldin. All Rights Reserved
John Mauldin is president of Millennium Wave Advisors, LLC, a registered investment advisor. All material presented herein is believed to be reliable but we cannot attest to its accuracy. Investment recommendations may change and readers are urged to check with their investment counselors before making any investment decisions. Opinions expressed in these reports may change without prior notice. John Mauldin and/or the staff at Millennium Wave Advisors, LLC may or may not have investments in any funds cited above. Mauldin can be reached at 800-829-7273.
This information is not to be construed as an offer to sell or the solicitation of an offer to buy any securities and is provided for general information purposes only.
© 2005-2022 http://www.MarketOracle.co.uk - The Market Oracle is a FREE Daily Financial Markets Analysis & Forecasting online publication.


