Stock Market Developing Positive Divergence
Stock-Markets / Stocks Bear Market Mar 05, 2009 - 11:19 AM GMTBy: Marty_Chenard
 Is there a "pent up demand" brewing of investors who want to become BUYERS?
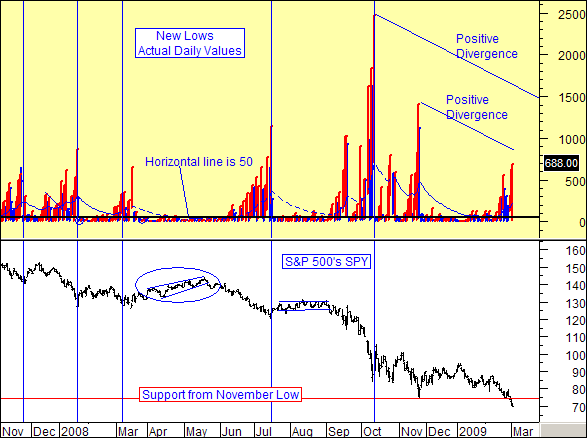
We have talked a lot about divergences in the past week. Today, we will address a Positive Divergence coming from the New York Stock Exchange's daily "New Lows".
Panic behaviors, selling, and the number of stocks making "new lows" are closely connected events .
Sometimes, just thinking about a chart or indicator "logically" is all you need to do. You don't need to buy a book or take a course to understand what is going on.
Such is the case with the count of daily New Lows reported by the New York Stock Exchange.
In the chart below, only two things are posted. The daily level of New Lows, and the daily level of the SPY.
First ... let's discuss the two behaviors mentioned above ... panic, and selling.
The dictionary describes "Panic" as:
1. A sudden, overpowering terror, often affecting many people at once.
2. A sudden widespread alarm concerning finances, often resulting in a rush to sell property: a stock-market panic.
When people panic in the stock market, they sell stocks. Since that is true, then panic selling in the stock market will result in more and more stocks reaching "New Lows" (as long as the panic levels are not subsiding or going away).
When people stop panicking, they stop selling. When they stop selling a stock ... it stops going down, and that means there is a cessation in making new lows.
So, if the number of daily New Lows goes higher and higher, you can expect that panic levels have been rising.
Now, with that thought in mind, look at the most recent peaks in New Lows going back to last November.
Is each subsequent peak higher or lower than the previous peak? Looking at the chart, it is easy to observe that each peak has been substantially less than the previous . That means that there has been less panic on each new selling event.
Each time the peak in New Lows dropped, the SPY (ETF for the S&P 500) has dropped lower.
Wait a minute you say ... the New Lows improved and the market fell lower?
On October 11, 2008, the stock market fell and the New Lows reached 2,477.
On November 20, 2008, the stock market fell LOWER and the New Lows were only 1404 ... an improvement of 43.3% over October's level.
And then this week on February 3rd, the stock market fell LOWER than October's and November's low ... and the New Lows were only 688 ... an improvement of 72.2% over October's level.
That is a classic definition of a "Positive Divergence".
Positive divergences are often a sign of "pent up demand". That is a situation where more and more buyers slowly want to buy ... but don't. This process continues ... with more potential buyers arriving, but not brave enough to buy.
Eventually, buying starts ... and when it does, all those "pent up buyers" sitting on the sidelines jump of their chairs and start buying.
The positive divergence we are seeing from the New Lows is depicting a slow five month process that has been slowly building.
Nobody knows how long this has to go on until a "critical mass" is reached. (Definition of critical mass: An amount or level needed for a specific result or a new action to occur .)
Eventually, we will reach that "needed amount". We don't know when , but the increasing positive divergence from the New Lows is saying that it may be sooner than many are expecting.
(Note: The chart below is posted every day on our paid subscriber site.)

________________________________________________
*** Feel free to share this page with others by using the "Send this Page to a Friend" link below.
By Marty Chenard
http://www.stocktiming.com/
Please Note: We do not issue Buy or Sell timing recommendations on these Free daily update pages . I hope you understand, that in fairness, our Buy/Sell recommendations and advanced market Models are only available to our paid subscribers on a password required basis. Membership information
Marty Chenard is the Author and Teacher of two Seminar Courses on "Advanced Technical Analysis Investing", Mr. Chenard has been investing for over 30 years. In 2001 when the NASDAQ dropped 24.5%, his personal investment performance for the year was a gain of 57.428%. He is an Advanced Stock Market Technical Analyst that has developed his own proprietary analytical tools. As a result, he was out of the market two weeks before the 1987 Crash in the most recent Bear Market he faxed his Members in March 2000 telling them all to SELL. He is an advanced technical analyst and not an investment advisor, nor a securities broker.
Marty Chenard Archive |
© 2005-2022 http://www.MarketOracle.co.uk - The Market Oracle is a FREE Daily Financial Markets Analysis & Forecasting online publication.


