Collective Thoughts Of Investors Point To More Stock Market Losses
Stock-Markets / Stocks Bear Market Mar 03, 2009 - 12:18 PM GMTBy: Chris_Ciovacco

 "The current state of investors’ collective fear means the odds remain against those who own stocks and in favor of those who short stocks or remain defensive."
Charts Capture These Collective Thoughts & Fears: The S&P 500 is now below the critical level of 741. We should expect rallies, but they do not mean much unless we can close and hold above 741. Investors’ collective hopes and fears, along with perceptions of value and future economic activity, are captured in charts. These are the same factors (hopes, fears, and perceptions) that determine the value of financial assets. When you understand this concept, you can appreciate the value of charts and technical analysis when making investment decisions.
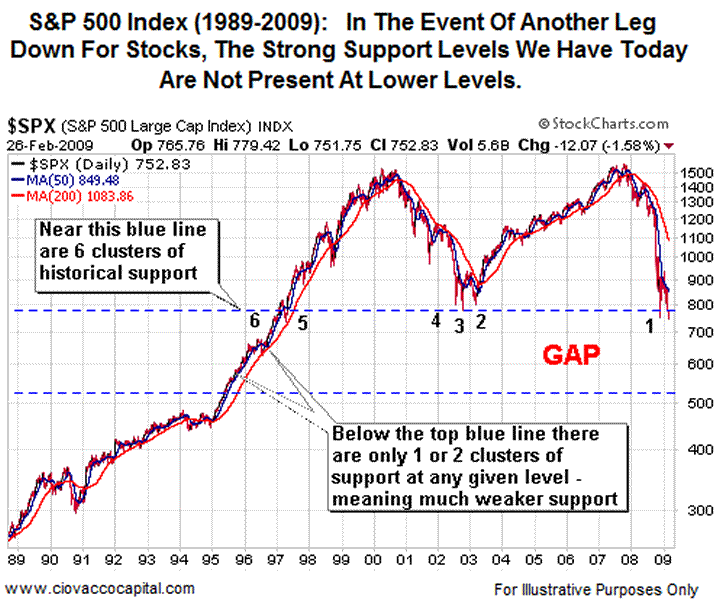
In the final analysis, what we at CCM “think” about the markets does not matter any more than what an individual investor may happen to "think". What does matter and what drives assets prices is what the market collectively thinks. It did not matter that Warren Buffet thought stocks were cheap late last year – collectively investors disagreed with him – he lost money. Ultimately, Buffet may be proven to be right, but there is no need for us to argue with the market. When the market begins to see what Mr. Buffet sees, it will show up clearly on a chart. Last week, we presented the chart below outlining the risks if support near 741 on the S&P 500 did not hold (the chart was created after the close on 2/26/09).

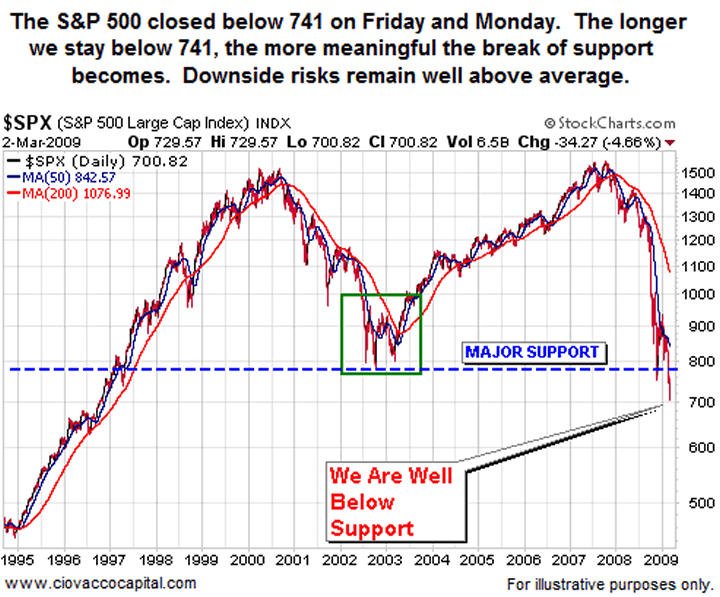
Support did not hold and stocks dropped in two trading sessions from 752 to Monday’s intraday low of 699 (a decline of 7% in two days). The fact that major support was broken last week is not simply a break of a line on a chart. It represents investors collectively deciding the state of the economy and future economic outlook do not currently justify the S&P 500 holding above 741. The S&P 500 held above 741 for over three months, which represented the collective belief the November 2008 and 2002-2003 lows would hold. Investors no longer hold that belief. The shift in investors’ perception should not be ignored. The graph below shows a little closer view of the 2002-2008 support including the activity of the last two trading days.

On Wall Street, many money managers start their careers using a purely fundamental approach. Over time, many come to appreciate the value of technical analysis (charts). In fact, it is not unusual for fundamental managers to eventually add technical analysis to their tool kit. Some managers go so far as to abandon the fundamentals all together and focus exclusively on the technicals (not something we recommend). It should tell you something about the effectiveness of technical analysis that in my fifteen years on Wall Street, I have never seen a manager who started with a technical approach convert to a purely fundamental approach – never.
At CCM, we believe the best approach is to use both fundamental analysis and technical analysis. However, if given the choice of only using one, we would not hesitate to choose the technicals because of their usefulness in sound money management. Currently, the fundamentals remain weak. The technicals are weak too. The primary trend in stocks remains firmly down, which means the collective thoughts of investors on average are negative relative to the attractiveness of stocks. A trendline is not simply a line on a chart – it is a way to measure the current tendencies of investors – the same investors who are going to determine the value of your investments. It literally pays to understand what they are thinking and feeling. Currently, investors remain cautious and fearful. The current state of investors' collective fear means the odds remain against those who own stocks and in favor of those who short stocks or remain defensive.
Another Weak Attempt To Calm Markets: This morning the Wall Street journal ran a story 'Bad Bank' Funding Plan Starts to Get Fleshed Out . The timing of the government's endless financial bailout announcements is always interesting. With all major stock markets hitting new bear market lows, we can guess recent dialog concerning the markets in Washington went something like this:
Mr. President, with both the November 2008 and 2002 stock market lows no longer providing support, the S&P 500 could fall rapidly toward 600. Sir, we are afraid the selling could begin to pick up significantly given the recent grim economic news and the sure to be ugly employment report due this Friday. We suggest getting some new information out about our yet to be detailed plans to deal with toxic assets. We don't have much to release, but we can ask the reporters to use words and phrases like (all included in the Journal's article):
-
“Filling in some of the blanks”
- “Considering”
- “No decision has been made on the final structure”
- “Possibly”
- “Many details remain unclear”
- “The Fed and the Obama administration also are mulling...”
- “The idea might not move forward.”
Mr. President, this will give the market a reason to hope. We have to do something!
You would think after universally negative reaction to Treasury Secretary Geithner's much anticipated February 10, 2009 announcement the administration would realize the financial markets want details. The market needs to know the rules of the game. Today's Wall Street Journal article contains very little new information and it hedges all the information with "no decision has been made on the final structure" of the plan. These vague announcements tend to generate some limited short-term interest that inevitably is followed by the same concerns about the lack of specific details.
As stated above, we should expect rallies in stocks , but they do not mean much unless we can close and hold above 741. The primary trend of investor's collective outlook for stocks remains negative.
By Chris Ciovacco
Ciovacco Capital Management
Copyright (C) 2009 Ciovacco Capital Management, LLC All Rights Reserved.
Chris Ciovacco is the Chief Investment Officer for Ciovacco Capital Management, LLC. More on the web at www.ciovaccocapital.com
Ciovacco Capital Management, LLC is an independent money management firm based in Atlanta, Georgia. As a registered investment advisor, CCM helps individual investors, large & small; achieve improved investment results via independent research and globally diversified investment portfolios. Since we are a fee-based firm, our only objective is to help you protect and grow your assets. Our long-term, theme-oriented, buy-and-hold approach allows for portfolio rebalancing from time to time to adjust to new opportunities or changing market conditions. When looking at money managers in Atlanta, take a hard look at CCM.
All material presented herein is believed to be reliable but we cannot attest to its accuracy. Investment recommendations may change and readers are urged to check with their investment counselors and tax advisors before making any investment decisions. Opinions expressed in these reports may change without prior notice. This memorandum is based on information available to the public. No representation is made that it is accurate or complete. This memorandum is not an offer to buy or sell or a solicitation of an offer to buy or sell the securities mentioned. The investments discussed or recommended in this report may be unsuitable for investors depending on their specific investment objectives and financial position. Past performance is not necessarily a guide to future performance. The price or value of the investments to which this report relates, either directly or indirectly, may fall or rise against the interest of investors. All prices and yields contained in this report are subject to change without notice. This information is based on hypothetical assumptions and is intended for illustrative purposes only. THERE ARE NO WARRANTIES, EXPRESSED OR IMPLIED, AS TO ACCURACY, COMPLETENESS, OR RESULTS OBTAINED FROM ANY INFORMATION CONTAINED IN THIS ARTICLE. PAST PERFORMANCE DOES NOT GUARANTEE FUTURE RESULTS.
Chris Ciovacco Archive |
© 2005-2022 http://www.MarketOracle.co.uk - The Market Oracle is a FREE Daily Financial Markets Analysis & Forecasting online publication.


