SEC Market Regulation and FAS 157 Contributions Towards Financial Markets Chaos
Stock-Markets / Market Regulation Mar 02, 2009 - 03:51 PM GMTBy: Frank_Holmes
 Good Intentions, Unintended Consequences - Not long ago, financial regulators told Congress that the year-old accounting rule known as FAS 157 had little to do with last year's string of high-profile bank failures. This blanket exoneration, however, is not supported by the evidence.
While I don't think FAS 157 is the only reason for the problems encountered by banks, brokerages and other financial firms, it seems that this rule and other regulatory actions may have played an unintended yet significant role by exaggerating the risks associated with the banks' heavily leveraged balance sheets.
It's important that these potential cause-and-effect relationships be explored because the Obama administration and Congress have made it clear that enacting more market regulations will be one of their top priorities. But this is a delicate time in our financial markets—the layering of complex new rules over complex old rules without fully understanding how they will fit together could cause more harm than good.
 FAS 157 changed how companies establish the value of securities when there is little or no active trading in those securities. As a result of this rule change, many financial companies have written off untold billions of dollars worth of securities on their balance sheets, even if these securities continued to produce income.
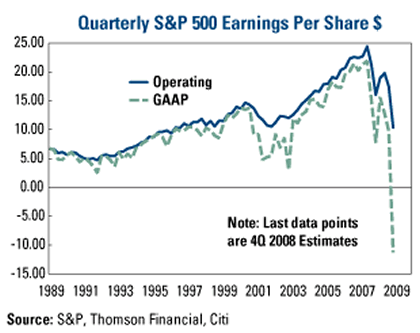
The above chart tracks the relationship between quarterly operating EPS for the S&P 500 (solid line) and the net EPS, which includes writedowns and other special one-time items. As you can see, for most of the past 20 years, the two lines have moved together. But look at the far right side—the operating profits were down, but net earnings were down much more.
I believe a strong case could be made that the sharp falloff in net earnings is largely due to FAS 157-related writedowns by financial companies, which were the largest sector of the S&P 500.
We all want the financial sector to be healthy again, but as Forbes accurately pointed out last week, FAS 157 takes away the time these institutions need to heal. A lack of healing time in the 1930s, when rules similar to FAS 157 were in place, deepened and prolonged the Great Depression.
Concerning the current financial meltdown, Wall Street, Main Street and government agencies were all excessively leveraged, and a rule change for short-selling that eliminated the uptick rule set off a feeding frenzy by predatory short sellers. Banks and brokerages sought to raise capital to rebuild their balance sheets, but short-selling mercilessly drove down the value of their shares and impaired their ability to raise enough new money.
Lacking capital, the banks had to cut back on new loans, which hurt manufacturers and others that need access to short-term working capital to run their businesses. Products didn't get made, workers didn't get paid and before long the economy ground to a halt.
The banks also made margin calls against existing loans, including those to highly leveraged hedge funds. To get their hands on cash, the hedge funds sold liquid assets, among them natural resources and emerging markets equities that had been performing so well.

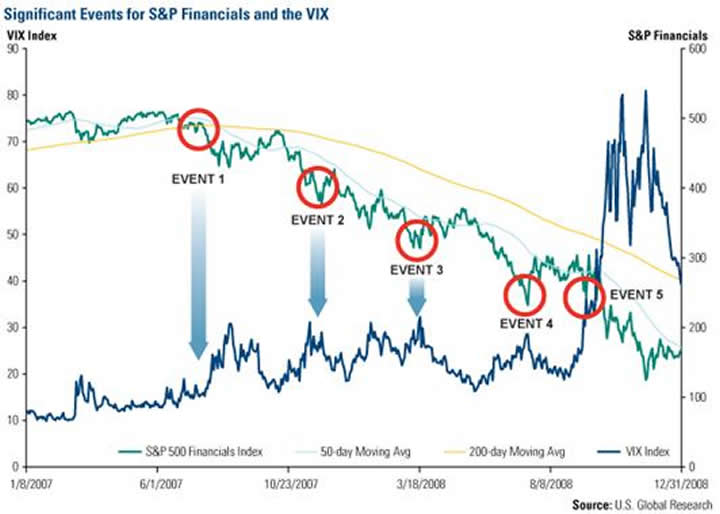
The chart above plots the performance of the S&P 500 Financial Index alongside the VIX, which measures market volatility, for 2007 and 2008. The general trends are clear to see: the financials declined more than 60 percent over the period, while market volatility dramatically increased.
Key events during the two years are marked with red circles.
Event 1— In July 2007, the SEC removed the uptick rule that required any short sale of a stock be done following an uptick in the price of that stock. The S&P financials essentially traded sideways prior to the removal of the uptick requirement, but they fell more than 12 percent in the first month after the rule change and at the same time the VIX nearly doubled.
Event 2— Volatility leaped in mid-November 2007, at the same time that FAS 157 was implemented. The S&P financials continued trending down. Citigroup CEO Charles Prince retired under pressure and Merrill Lynch CEO Stanley O'Neal was ousted around this time.
Event 3— In mid-March 2008, Bear Stearns collapsed under the weight of its exposure to mortgage-related derivatives, creating another volatility spike.
Event 4— In mid-July, the SEC restricted short sales of the 19 largest financial companies. This included shares of Fannie Mae and Freddie Mac, both of which had huge exposure to mortgage securities. The beleaguered S&P financials bounced up on the news, while volatility declined.
Event 5— In mid-September, just a few days after the collapse of Lehman Brothers, the SEC temporarily banned short selling of about 1,000 financial stocks. Many of these companies had reported many billions of dollars in FAS 157-related write-offs. Initially, the S&P financials popped up but the longer-term downward trend quickly resumed. Volatility shot up to record levels.
That these market events occurred in tandem with significant regulatory actions was likely not a coincidence.
I have no doubt that the elimination of the uptick rule and the implementation of FAS 157 were intended to benefit investors, just as Sarbanes-Oxley was when it was enacted several years ago. And under different circumstances, the impact of these rules may have been less onerous on the financial companies. But with so much balance-sheet leverage for these companies, it turned out to be a recipe for disaster.
It reminds me of 1986, when markets were hammered by the combination of the Reagan administration's tax reforms, a rapid falloff in oil prices and the high degree of leverage being carried by savings-and-loans. Any one of these challenges would not have been a big problem—putting them all together led to the failure of hundreds of financial institutions and destabilization of the nation's banking system.
Like in 1986, the fundamental problem in 2008 was dangerous levels of debt carried by Wall Street banks and brokerages (along with Fannie Mae and Freddie Mac) and Main Street homeowners.
There may have been a way to address the current overleveraging in an orderly fashion if the rules were different, but as the chart above supports, a case could be made that the convergence of FAS 157, highly leveraged balance sheets and the loss of the uptick rule were the trigger that set off the financial meltdown.
By Frank Holmes, CEO , U.S. Global Investors
Frank Holmes is CEO and chief investment officer at U.S. Global Investors , a Texas-based investment adviser that specializes in natural resources, emerging markets and global infrastructure. The company's 13 mutual funds include the Global Resources Fund (PSPFX) , Gold and Precious Metals Fund (USERX) and Global MegaTrends Fund (MEGAX) .
More timely commentary from Frank Holmes is available in his investment blog, “Frank Talk”: www.usfunds.com/franktalk .
Please consider carefully the fund's investment objectives, risks, charges and expenses. For this and other important information, obtain a fund prospectus by visiting www.usfunds.com or by calling 1-800-US-FUNDS (1-800-873-8637). Read it carefully before investing. Distributed by U.S. Global Brokerage, Inc.
All opinions expressed and data provided are subject to change without notice. Some of these opinions may not be appropriate to every investor. Gold funds may be susceptible to adverse economic, political or regulatory developments due to concentrating in a single theme. The price of gold is subject to substantial price fluctuations over short periods of time and may be affected by unpredicted international monetary and political policies. We suggest investing no more than 5% to 10% of your portfolio in gold or gold stocks. The following securities mentioned in the article were held by one or more of U.S. Global Investors family of funds as of 12-31-07 : streetTRACKS Gold Trust.
Frank Holmes Archive |
© 2005-2022 http://www.MarketOracle.co.uk - The Market Oracle is a FREE Daily Financial Markets Analysis & Forecasting online publication.


