U.S. Dollar, Crude Oil and Gold Teetering Bull Markets
Commodities / Financial Markets 2009 Mar 01, 2009 - 03:23 PM GMTBy: Chris_Vermeulen

 The past 6 months have been every interesting, as the financial markets try to find a bottom while banks go bankrupt and more and more investment scandals continue to pop up on the radar destroying investor's life savings literally over night. It still sounds crazy, when I hear banks are going bankrupt and it just goes to show anything can happen.
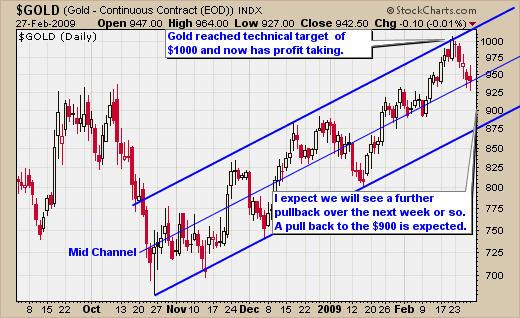
The feds continue to poor billions of USD's into the system, when everyone is 100% sure the USD is about to become worthless. The USD has been consistently stronger, even though the feds continue to dilute the world with more $$$$ on a monthly basis. Gold has also been increasing in value, reaching $1000 a week ago, as foreign currencies decline, sending the rest of the world buying gold as a safe haven.
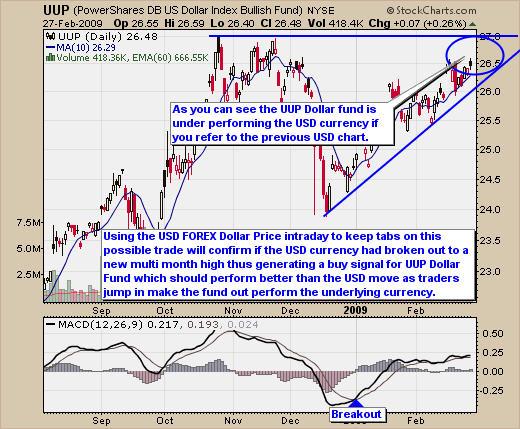
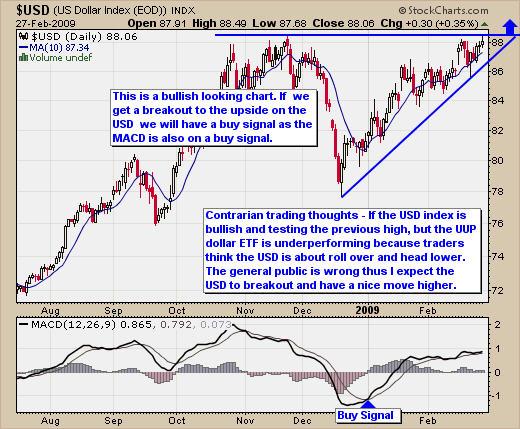
The charts below, of the USD currency and the UUP Dollar ETF, show something, which I think will be interesting to watch. Exchange traded funds are known for not following the underlying vehicle perfectly, which is something that, us as traders, just have to live and learn to deal with. But the funds can provide us with some interesting opportunities from time to time. The two charts below show the strength of the US Dollar and currently testing the highs formed back in November and forming a bullish wedge indicating a breakout to the upside is likely to happen. If we do get a breakout, my target for the USD is around the 95 area.
Now take a look at the chart of the UUP fund, which allows traders to trade the USD. What do you see? The fund is underperforming, which can be seen by looking at the price, which is 2% below the November high resistance line. What I am looking to see here is, for the USD to breakout above the November high, which will trigger the UUP fund to surge higher, as it must also breakout to new highs, generating a quick pop in price adding 1-2% extra potential out of this possible setup.
USD Currency Price – Daily Trading Chart
UUP Dollar Fund – Daily Trading Chart
Spot Gold & Gold ETF Trading Charts
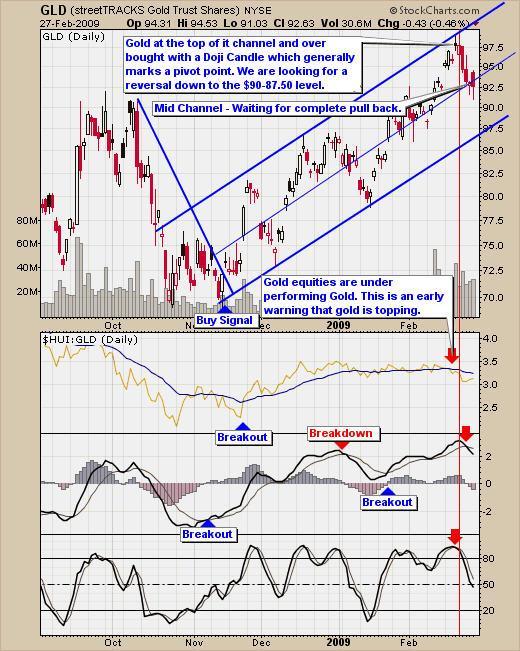
Gold has been a little trickier to trade recently, simply because gold's correlation to the USD has been off. Both gold and the USD are moving together in sync, but at any time, they could snap back to their normal inverse trading relationship. If this happens and the USD continues to move higher, gold will decline in value and really frustrate the majority of investors, who just dumped their investments into gold. The market always moves in the direction, which will hurt the majority of investors (general public investors) and this is why I want to mention it. Everyone in my opinion and from all the people I talk with, are long gold, and everyone thinks the US dollar is going to crash. Seems right for gold to continue down or move sideways like it did for all of 2006 and 2007, to shake investors out, as they start putting their money to work where things are showing returns, only for the price of gold to make a huge run higher after the majority of the general public gets out.
That being said, I don't care which way it goes, as I just follow the price action and trade long or short, when there is a tradable setup with risk under 3% using my trading model. It is a little more difficult to trade now, as volatility is much higher with risk of generally over 3% during setups, but when volatility is high, I prefer to hold mostly cash and wait for some of the dust to settle, only taking setups when risk is within my trading model requirements.
GLD Gold ETF Trading Chart
Gold corrected last week, as expected from looking at the trading chart. Gold has been trading at the top of its trend channel with gold stocks starting to underperform the price of gold and stochastic indicator topping out and hooking down. Gold is currently trading at the mid support level and could find some additional support. We would like to see the price continue lower to the bottom of the channel, where we could possibly end up having a buy signal. I expect GLD to continue to pull back to the $87.5 - $90 level before providing a reversal candle, at which point, we could buy gold for a long trade.
Spot Gold End of Day Trading Chart
Spot gold chart shows the same, but I thought I would show it, so we can see the actual gold prices, when there is a buy or sell signal for physical gold bullion and coin traders.
Strike It Rich with Crude Oil
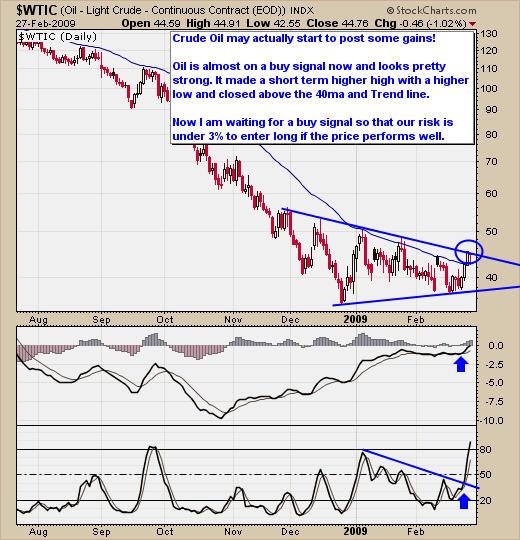
Crude oil made some positive progress last week, as the price climbed up and over $44 per barrel. This move higher has provided several technical trading signals, which will help get investors into this slippery investment. Oil posted a nice gain last week and in doing so, provided us with oil closing over the 40 moving average and posting a new multi week high. The MACD broke out, which has been consolidating for several weeks, which is bullish and the stochastic indicator broke out and made a new multi month high.
These are great to see and once we have a clean trend line break and setup, I think we will see some exciting prices for crude oil.
Trading Conclusion:
The US dollar I think will be interesting to watch and take part in if we get a setup. The double leveraged dollar fund (UUP) provides some excellent trades and setups. Considering everyone is bearish on the dollar it makes me like this trade even more.
Gold is currently several days away from any buy or sell signal, so we will continue to watch it unfold over the next week or so.
Crude Oil is really starting to look interesting and could provide us with a nice trade soon. One more positive day on oil and it will generate a full buy signal. I will be waiting for a pullback and reversal when an up trend line will not be as steep. Current down side risk is over 16% from support, which is much too high for me. I just finished reading a book written by JT Grenough, about what you can do to protect yourself in this new world order economic environment. It's about crisis investing for 2009 covering gold, oil and real estate. Definitely worth reading!
Hello, I'm Chris Vermeulen founder of TheGoldAndOilGuy and NOW is YOUR Opportunity to start trading GOLD, SILVER & OIL for BIG PROFITS. Let me help you get started.
I have put together a Recession Special package for yearly subscribers which is if you join for a year ($299) I will send you $150 FREE in gas, merchandise or grocery vouchers FREE which work with all gas stations, all grocery stores and over 100 different retail outlets in USA & Canada.
If you interested please act fast as I only have 67 of these vouchers before they are gone for good.
If you would like to receive my free weekly market updates please visit my website: www.TheGoldAndOilGuy.com
I look forward to hearing from you soon!
By Chris Vermeulen
Chris@TheGoldAndOilGuy.com
Please visit my website for more information. http://www.TheGoldAndOilGuy.com
Chris Vermeulen is Founder of the popular trading site TheGoldAndOilGuy.com. There he shares his highly successful, low-risk trading method. For 6 years Chris has been a leader in teaching others to skillfully trade in gold, oil, and silver in both bull and bear markets. Subscribers to his service depend on Chris' uniquely consistent investment opportunities that carry exceptionally low risk and high return.
This article is intended solely for information purposes. The opinions are those of the author only. Please conduct further research and consult your financial advisor before making any investment/trading decision. No responsibility can be accepted for losses that may result as a consequence of trading on the basis of this analysis.
Chris Vermeulen Archive |
© 2005-2022 http://www.MarketOracle.co.uk - The Market Oracle is a FREE Daily Financial Markets Analysis & Forecasting online publication.
Comments
|
robert
02 Mar 09, 12:09 |
RE: U.S. Dollar, Crude Oil and Gold Teetering Bull Markets
Oil and Gold both look ready to tank. Especially oil. Going into the low 30's for sure. |


