


Global Recession Deepens as No End to Financial Collapse
Economics / Recession 2008 - 2010 Mar 01, 2009 - 02:25 PM GMT

 Reuters: Soros sees no bottom for world financial “collapse”
“Renowned investor George Soros said on Friday the world financial system has effectively disintegrated, adding that there is yet no prospect of a near-term resolution to the crisis.
“Soros said the turbulence is actually more severe than during the Great Depression, comparing the current situation to the demise of the Soviet Union.
“He said the bankruptcy of Lehman Brothers in September marked a turning point in the functioning of the market system.
“‘We witnessed the collapse of the financial system,' Soros said at a Columbia University dinner. ‘It was placed on life support, and it's still on life support. There's no sign that we are anywhere near a bottom.'
“His comments echoed those made earlier at the same conference by Paul Volcker, a former Federal Reserve chairman who is now a top adviser to President Barack Obama.”
Source: Reuters , February 21, 2009.
Bloomberg: John Bogle says recession may last another two years
“The 53% plunge in the Standard & Poor's 500 Index indicates investors expect the recession to last another two years, according to John Bogle, who created the $68.8 billion Vanguard 500 Index Fund in 1976.
“‘These are certainly the times that try men's souls, and particularly investors' souls,' he said during a Bloomberg Television interview from Washington. The stock market has ‘got to be discounting an awful lot of the bad economy that we see ahead. We've got to be getting close to the lows in the stock market finally.'”

Source: Bloomberg , February 24, 2009.
CEP News: Bernanke says full economic recovery more than two to three years away
“Federal Reserve Chairman Ben Bernanke said a full economic recovery is at least another two to three years away and that a low Fed rate will be in place for some time.
“During his semi-annual testimony before the US Senate Banking Committee, Bernanke noted that the start of an economic recovery in 2010 will only be possible with a stabilization in markets and banks.
“‘If actions taken by the Administration, the Congress, and the Federal Reserve are successful in restoring some measure of financial stability - and only if that is the case, in my view - there is a reasonable prospect that the current recession will end in 2009 and that 2010 will be a year of recovery,' Bernanke said in his prepared opening remarks.
“However, he noted the view of policy-makers that ‘a full recovery of the economy from the current recession is likely to take more than two or three years.'
“The chairman also said the Fed's ‘exceptionally low' interest rates will be in place for some time as ‘significant stresses' persist in many markets. He forecasts the ‘sharp contraction' to continue into the first quarter.
“Bernanke noted further that the Fed is committed to using ‘all available tools' to help the economy out of the current ‘severe contraction'.”
Source: CEP News , February 24, 2009.
CNBC: Fed Chairman Ben Bernanke's testimony
“Federal Reserve chairman Ben Bernanke presents his semiannual monetary policy report to Congress.”
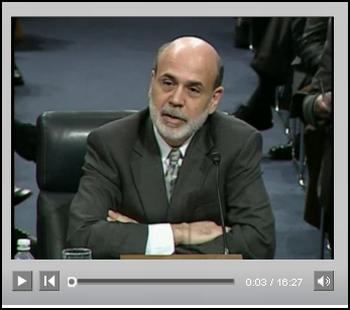
Source: CNBC , February 24, 2009.
CEP News: Obama budget calls for another $750 billion to safeguard banks
“Another $750 billion in aid to the financial system and $635 billion in spending on an overhaul of the US health care system will bring the budget deficit to an unprecedented $1.75 trillion by September 30, 2009, according to US President Barack Obama's budget proposal.
“The ambitious proposal, which goes to Congress on Thursday, would bring budget spending to 12% of GDP, and will be partially funded by tax increases for families earning more than $250,000 per year, as well as tax increases on hedge fund managers.
“The proposal also specifies that fiscal spending in 2009 will hit a record $3.94 trillion, a 32% increase from last year, and $3.55 trillion in 2010, a 9.8% decline.
“By 2010, the deficit is forecast to fall to $1.17 trillion. Obama hopes to cut the deficit in half over the next four years.
“The proposal suggests that the unemployment rate in the US will average 8.1% in 2009, and that CPI will decline 0.6%.
“The Obama plan also includes a $635 billion spending bill for updating the US health care system, which will help millions of Americans and is crucial to helping jump-start the economy, the White House says.
“The bill also seeks $75.5 billion in war funding for 2009 and $130 billion for 2010.
“In addition, the Obama budget proposes to cancel some tax cuts for natural gas and oil producers and hopes to lower greenhouse gas emissions to 15% below 2005 levels by 2020, and to 83% below 2005 levels by 2050. The president would also like to invest $150 billion over 10 years in clean energy technology.”
Source: CEP News , February 26, 2009.
Financial Times: FT's Martin Wolf on US budget
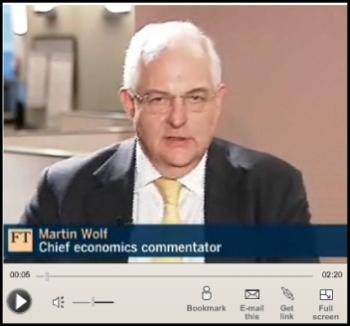
Click here for the article.
Source: Financial Times , February 26, 2009.
Asha Bangalore (Northern Trust): Decline in GDP larger than advance estimate
“Real gross domestic product (GDP) declined at an annual rate of 6.2% in the final three months of 2008, which is a significantly larger drop compared with the advance estimate of a 3.8% contraction. As the indicates, the size of the decline in the fourth quarter matches very few instances in the post-war period.
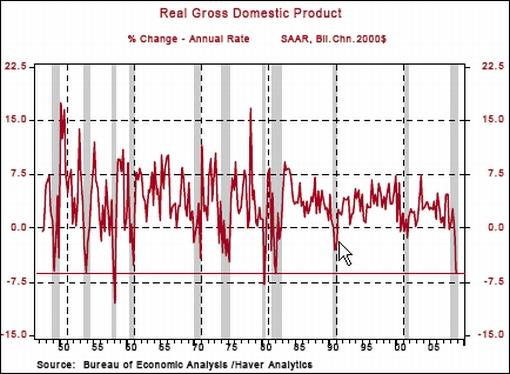
“All major components of GDP were revised down in the preliminary report, excluding residential investment expenditures (-22.2% versus -23.6% in advance estimate). The largest downward revision was from inventories (-$19.9 billion versus $6.2 billion). Consumer spending fell at an annual rate of 4.3% in the fourth quarter (advance estimate was -3.5%) putting the year-over-year decline at 1.6%, the largest decline since the third quarter of 1951.”
Source: Asha Bangalore, Northern Trust - Daily Global Commentary , February 27, 2009.
Bespoke: A government hit to housing
“Regardless of your political affiliation, it's hard to argue that Obama's new health care proposal paid for partially by cutting deductions on mortgage interest won't have a negative impact on the housing market at a time when the administration has said it's trying to help the struggling industry. Below are links to articles on the proposed tax hikes from various publications:
WSJ: $318 Billion Tax Hit Proposed
Bloomberg: Obama Planned Tax Would Hit Highest Earners Hardest
NY Times: To Pay For Health Care, Obama Looks to Taxes on Affluent
Source: Bespoke , February 26, 2009.
Standard & Poor's: S&P/Case-Shiller Home Prices Indices - record declines
“Data through December 2008, released today by Standard & Poor's for its S&P/Case-Shiller Home Price Indices show that the prices of existing single family homes across the United States continue to set record declines, a trend that prevailed throughout all of 2007 and 2008.
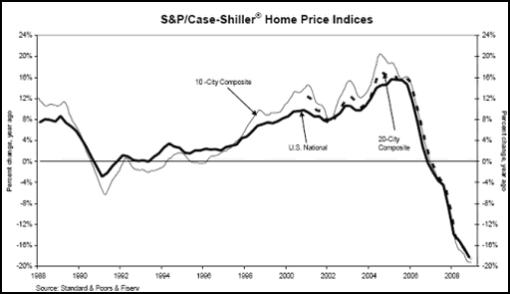
“The chart above depicts the annual returns of the US National Home Price, the 10-City Composite and the 20-City Composite Indices. The decline in the S&P/Case-Shiller US National Home Price Index - which covers all nine US census divisions - recorded an 18.2% decline in the 4th quarter of 2008 versus the 4th quarter of 2007, the largest in the series' 21-year history. The 10-City and 20-City Composites also set new records, with annual declines of 19.2% and 18.5%, respectively.”
Click on the image below for an interview with David Blitzer, Chairman of the Index Committe at Standard & Poor's.
Sources: Standard & Poor's and CNBC , February 24, 2009.
Asha Bangalore (Northern Trust): New home sales point to deepening economic malaise
“Sales of new single-family homes fell 10.2% in January to an annual rate of 309,000 units, a new record low. Sales of new single-family homes declined in the Midwest (-5.6%), South (-6.5%), and West (-28.0%) but rose in the Northeast (+12.5%).
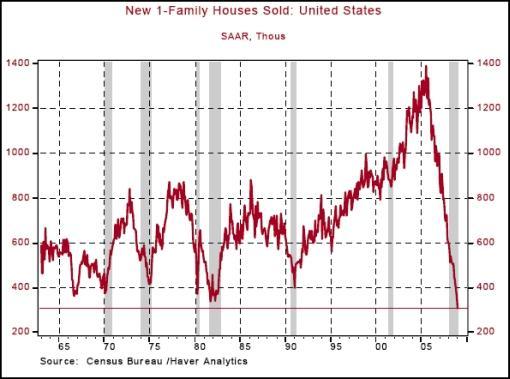
“Additional declines in prices of new homes are nearly certain, given the inventory of unsold new homes. There was a 13.3-month supply of new single-family homes in the market in January, also a new record.”
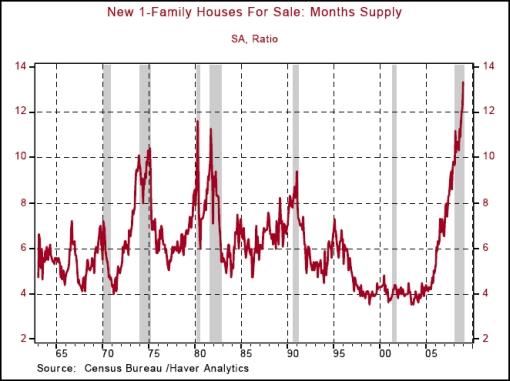
Source: Asha Bangalore, Northern Trust - Daily Global Commentary , February 26, 2009.
Asha Bangalore (Northern Trust): Existing home sales maintain downward trend
“Sales of all existing homes declined 5.3% to 4.49 million units in January. Purchases of single-family homes fell 4.7% to an annual rate of 4.05 million units, which is 36% below the cycle peak in September 2005 (6.34 million units).
“The inventory situation of existing single-family homes bodes poorly for home prices in the months ahead. The seasonally adjusted inventory of existing single-family homes has hovered above a 9.3-month supply mark in the past twelve months. In January, the inventory-sales ratio was a 9.9-month supply, up from a 9.7-month supply the previous month.”
Source: Asha Bangalore, Northern Trust - Daily Global Commentary , February 25, 2009.
Nationwide: Improving housing affordability in UK
“The price of a typical house [in the UK] fell by 1.8% in February, bringing the annual rate of change to -17.6% and the price of a typical house down to £147,746, from £179,358 this time last year. Sharp cuts in interest rates have helped affordability, but have not yet affected housing market confidence sufficiently to boost the levels of new transaction activity or slow the pace of house price falls. Early signs of increased interest in housing, as reported by the pick up in new buyer enquiries, have yet to filter into sales, but do suggest that falling prices and interest rates are raising curiosity now, which could flow through quickly once confidence returns.
“However, there are some very early signs that borrowers are perhaps becoming a little more optimistic about the path of house prices. The pace of fall in consumers' expectations of future house prices has moderated, which could suggest that confidence in the market may begin to pick up later this year.”
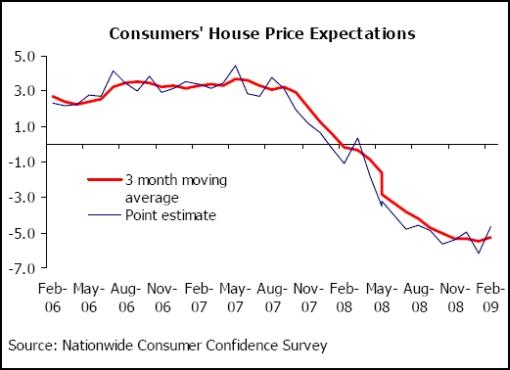
Source: Nationwide , February 26, 2009.
Asha Bangalore (Northern Trust): Consumer Confidence Index records new low
“The Conference Board's Consumer Confidence Index plunged to 25.0 in February versus 37.4 in January. This is a new record low for the series which dates back to February 1967. The two subcomponents - Present Situation Index (21.2 versus 39.7 in January) and the Expectations Index (27.5 versus 42.5 in January) - declined in January. The dire economic news in the media nearly every day is bound to be reflected in the consumers' evaluation of the economy.”
Source: Asha Bangalore, Northern Trust - Daily Global Commentary , February 24, 2009.
Asha Bangalore (Northern Trust): Loan delinquency and charge-offs rise in Q4 2008
“The delinquency rate of loans and charge-offs advanced in the fourth quarter. This is not entirely surprising. We need to stress that financially strapped households are in no position to spend more than necessary particularly in an environment of a rising unemployment rate. 4.20% of consumer loans were delinquent in the fourth quarter, the largest on record in the short history of this series. The previous high was 4.19% in the second quarter of 1991.
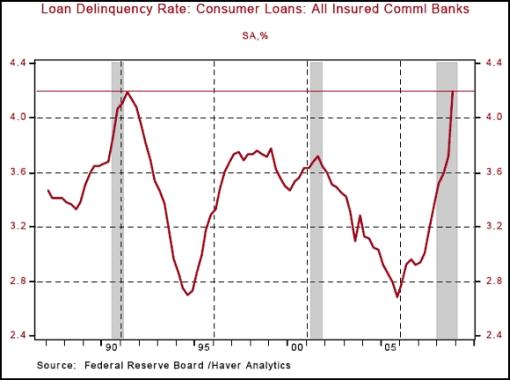
“The percentages of commercial and industrial loans (2.58% versus 1.78% in Q3) and real estate 5.78% versus 4.89%) delinquent in the fourth quarter were higher than in the third quarter.”
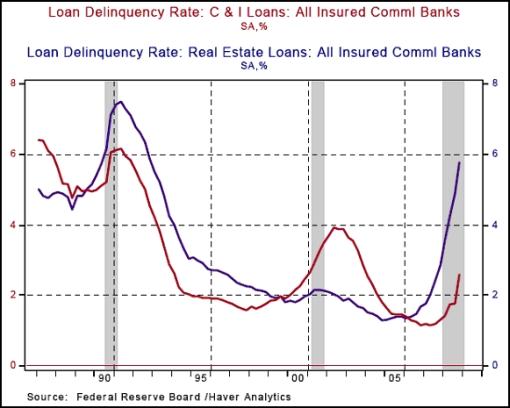
Source: Asha Bangalore, Northern Trust - Daily Global Commentary , February 24, 2009.
Bespoke: Strategist price targets - Credit Suisse is the first to budge
“Bloomberg tracks the S&P 500 price targets of the major Wall Street strategists in a weekly survey. This week, Credit Suisse was the first firm to lower its year-end price target this year, even as the market has already declined by 17%. As shown below, Credit Suisse lowered its price target from 1,050 to 920.
“At the start of the year, the average year-end price target suggested a gain of 16.2% for the S&P 500. Only one firm, Barclays, had a price target that suggested the index would decline for the year. With the S&P 500 down roughly 17% year to date and only one strategist lowering year-end estimates, the average strategist is now looking for a gain of 36% from current levels. Either the index has a lot of catching up to do, or strategists are going to have to once again start lowering estimates just like they did in 2008.”
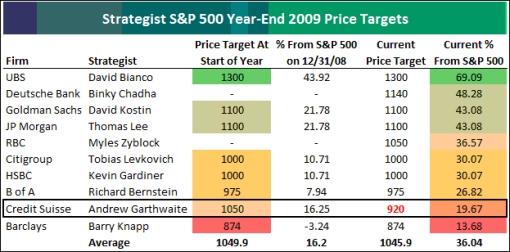
Source: Bespoke , February 24, 2009.
Tech Ticker, Yahoo Finance: Shiller - stocks not yet cheap enough for me
“Yale professor Robert J. Shiller, the author of ‘Irrational Exuberance', created one of the most useful and predictive measures of stock-market valuation: the cyclically-adjusted price-earnings ratio (CAPE). As Professor Shiller explains here, the CAPE mutes the impact of the business cycle by averaging 10 years of earnings. It thus provides a good picture of the market's value regardless of where we are in the business cycle.”

Source: Tech Ticker, Yahoo Finance , 24 February 2009.
Bloomberg: Faber says stocks may develop rally “relatively soon”
“Marc Faber, publisher of the ‘Gloom, Boom & Doom Report', says US stocks may still develop ‘some kind of rally relatively soon'. Faber also discusses the possibility of nationalizing US banks.”

Source: Bloomberg , February 23, 2009.
Financial Graph & Art: Bear market comparisons - 1929-2009
“The chart below is a comparison of the current market to all previous bear markets.”
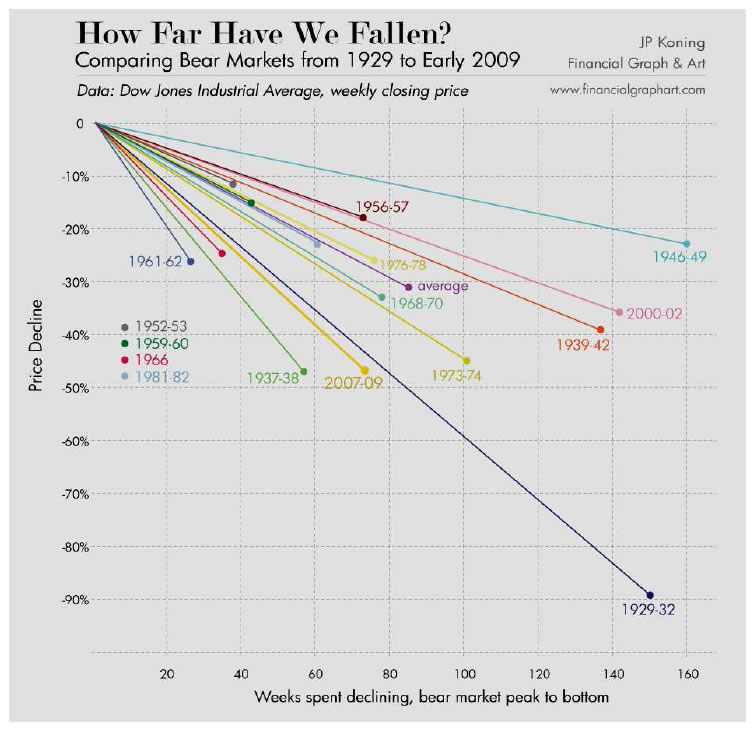
Source: JP Koning, Finanancial Graph & Art (hat tip: Barry Ritholtz ).
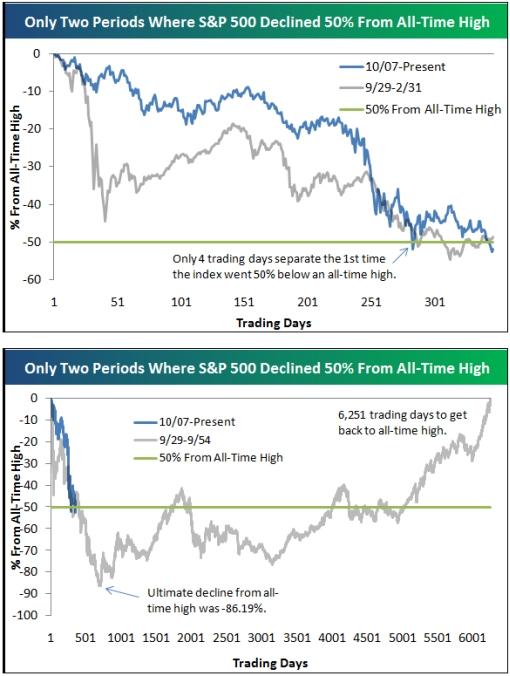
Bespoke: S&P 500 now down 52% from all-time high
“There have now only been two periods in the history of the S&P 500 where the index declined more than 50% from an all-time high - 1929 and now. In the first chart below, we highlight the percentage change from the S&P 500's most recent all-time high to its current level, along with the change from the 1929 all-time high over the same number of days. Although the front-page headline in the WSJ today is ‘Stocks Drop to 50% of Peak', the S&P 500 was actually down 50% from its peak back in November. It just recently hit the 50% threshold again.
“What is ominous about the first chart is that only four trading days separate the first time that the S&P 500 went 50% below its all-time high. Ultimately in the bear that started in 1929, the S&P 500 dropped a whopping 86.19% from its all-time high. This low occurred 679 trading days after the all-time high was reached, or about two years and nine months. The current decline has lasted one year and four months.
“But by far the most depressing aspect of the 50%+ decline back in the 1930s was how long it took for the index to make a new all-time high. Following the peak in 1929, the S&P 500 went 6,251 trading days before hitting a new all-time high 25 years later.
“Obviously a lot more has to happen for the market to continue lower and reach -86%, but the current declines aren't in good company.”
Source: Bespoke , February 24, 2009.
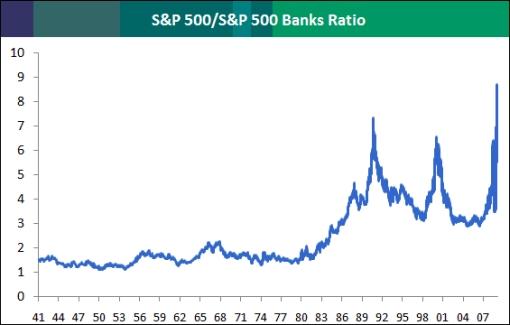
Bespoke: Financials wipeout
“In the first chart below we highlight a ratio of the S&P 500 to the S&P 500 Bank group going back to 1940. When the ratio is rising, the financials are getting weaker relative to the S&P 500 as a whole. As shown, the ratio is currently as high as it has been over the entire time period, meaning the banks are as small as they've been relative to the overall index. Where we go from here, nobody knows, but the financials are pretty much getting wiped off the investment map.
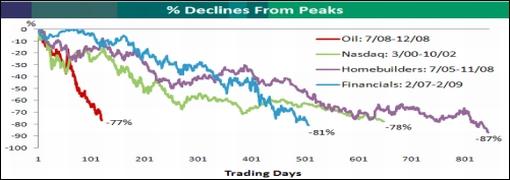
“Below we highlight the percentage declines from peaks of various asset class busts in the last decade. Prior to the declines that financials, oil, and homebuilders are seeing currently, the only recent comparison for the current generation of investors was the Nasdaq bust from 2000-2002. As shown, the Nasdaq went down 78% from its March 2000 peak to its October 2002 low. Following the bursting of the Internet bubble, many investors didn't think they'd see a similar bust for decades. But the current declines in financials and homebuilders have now eclipsed those of the Nasdaq, and oil has also gone down just as much.
“Oil's decline of 77% from July 2008 to its low in December was the fastest bust of the group, while homebuilders have gone down the most and for the longest period of time. Since July 2005, the homebuilders are down a whopping 87%! And the S&P 500 Financial sector is down 81%, which isn't as bad as the homebuilders, but given the fact that it didn't go up nearly as much as the homebuilders, it's probably worse.”
Source: Bespoke , February 23, 2009.
Financial Times: Tokyo eyes shares to prop up market
“Japan's government is considering buying shares to prop up the country's ailing stock market in a desperate attempt to prevent tumbling equity prices from inflicting further pain on its fragile economy.
“Kaoru Yosano, finance minister, said he had instructed government officials to look into measures to counter falling stock prices, including a 1960s scheme involving two consortia that spent Y400 billion ($4.1 billion) to counter selling pressure over two years.
“‘It is undesirable for share prices to fall, causing unnecessary consequences,' said Mr Yosano. ‘I discussed with government staff … what we could do generally to deal with [falling] share prices. We must consider this, keeping an eye on market moves.'
“Mr Yosano said that such measures could include setting up a government body to buy shares in the market.”
Source: Michiyo Nakamoto, Financial Times , February 24, 2009.
The Malaysian Insider: Dr Doom says US government bonds next bubble to burst
“As usual, Dr Marc Faber, the author of The Gloom Boom and Doom Report and contrarian views, did not disappoint the masochist in us as he gave his spiel on the causes of the current economic turmoil at a dialogue on Friday organised by The Business Times in partnership with Julius Baer.
“His topic ‘Were You Born Before Or After 2007′, that is, before or after the global economies began their steep decline, got nearly 400 bankers and businessmen intrigued enough to spend four-and-a-half hours at the Ritz Carlton Singapore.
“Luckily lunch was served before Dr Doom, as Dr Faber is often called, took the floor. The picture he painted was indeed gloomy, with no end in sight of what appears to be a very long tunnel.
“The present credit crisis caused by ultra expansionary monetary policies was very serious, he said - as if the audience of bankers and business were not already aware of this.
“He went on to add that non-financial credit growth has declined from an annual rate of 16% in late 2006 to between 1-2% now.
“The deleveraging taking place among financial intermediaries is negative for the American economy that is addicted to credit growth, he pointed out. The United States' trade and current account deficits will shrink further and diminish international liquidity. This is bad for asset prices.
“‘We had an unprecedented global economic boom between 2002 and 2007. A colossal global economic bust is now following,' he said.
“And worse might follow, as he noted: There was still one bubble more to be deflated - US government bonds.
“Adding more fuel to his fire of gloom was his warning that regardless of the policies followed by the US government and its agencies, the American consumer was in a recession, which will only deepen.”
Click here for the full article.
Source: The Malaysian Insider , February 25, 2009.
Gunnar Stangl (Dresdner Kleinwort): Corporate bankruptcies to surge
“History suggests that before a bottom in equity markets can be reached, there has to be a peak in corporate bankruptcies, says Gunnar Stangl, strategist at Dresdner Kleinwort.
“He points out that actual defaults and bankruptcies remained low in 2008, but he expects a significant increase this year.
“‘The number of corporate bankruptcies worldwide rose by about 14% in 2008 and is set to rise by at least another 20% in 2009,' he says. ‘We believe bankruptcy in most asset classes will be one of the key driving factors over the next months.'
“Mr Stangl says low interest rates have helped slow the bankruptcy rate but warns it will pick up given the broad reduction in credit, the diminishing value of assets used as collateral and weakening demand. He also says the liquidation of real estate assets will exert further pressure on the property market.
“‘Beyond the crisis - after the process of creative destruction has run its course - the biggest inhibitor to growth will be ‘zombie' companies; those allowed to continue on non-economic terms and which keep a lid on growth in a whole sector.
“‘Historically, post-recession recovery was fastest in the US, partly due to an efficient bankruptcy process.
“‘In terms of asset allocation, we feel the time to leave safe-havens and position for recovery has not yet come, while avoiding visible risks is still key.'”
Source: Gunnar Stangl, Dresdner Kleinwort (via Financial Times ), February 25, 2009.
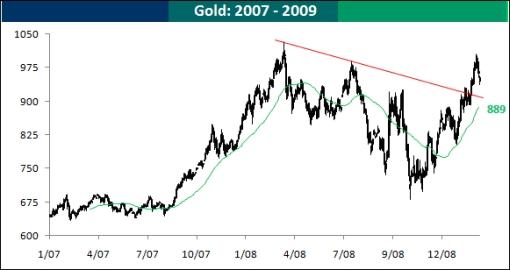
Bespoke: Gold's sell-off only pullback from overbought levels
“While the outlook for Federal debt and spending continues to rise, the price of gold has actually declined by more than 5% since closing above $1,000 on Friday (February 20). A look at that chart, however, shows that the price of gold remains comfortably above its 50-day moving average (889) and the one-year downtrend line that was in place since last Spring. As long as the price stays above these two price points, this week's sell-off is nothing more than a pullback from overbought levels.”
Source: Bespoke , February 26, 2009.
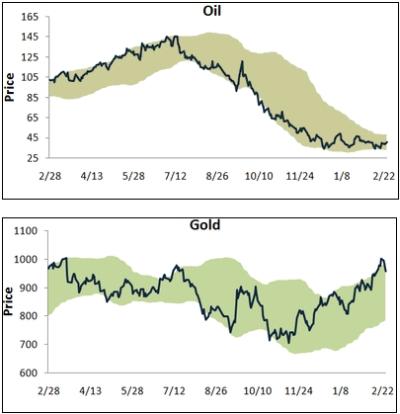
Bespoke: Commodity snapshot
“Below we highlight our trading range charts of gold and oil. The green shading represents between 2 standard deviations above and below the commodity's 50-day moving average, and moves above or below this area are considered overbought or oversold.
“From a technical perspective, oil has been trying to form a bottom over the past couple of months. It has tested its lows twice now and held support each time. The next point of interest for oil will be its resistance at its January highs. If it can break above these highs, a new short-term uptrend will have formed. Natural gas, on the other hand, continues to hit new lows within its long-term downtrend, and no bottom is in sight.
“Precious metals have been the one area of strength in commodities recently. But after moving into extreme overbought territory, gold, silver, and platinum have pulled back slightly. Gold has some major resistance at the $1,000 level, and it looks like it's going to take a lot to push it through.
“Other commodities like corn, wheat, and orange juice have moved back to the bottom of their trading ranges in recent days.”
Source: Bespoke , February 25, 2009.
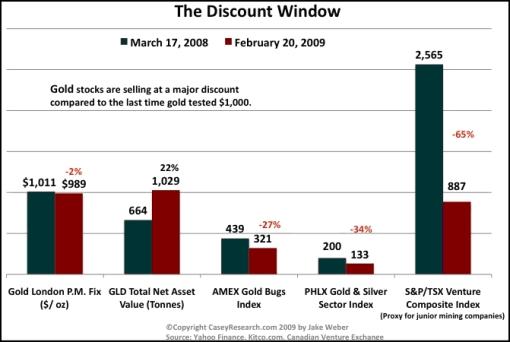
Casey's Charts: Junior gold miners trading at huge discount
“Positive investor sentiment towards the shiny metal has returned with a vengeance over the last year, evident in the global shortages of gold bullion and the 22% increase in holdings at the SPDR Gold Trust GLD. However, the companies that actually find and produce the metal have been caught up in the general equities sell-off that began last October.
“Gold stocks have certainly bounced back from their October lows, but are still nowhere near their levels of last March. With oil, one of the major input costs for mining companies, trading at a third of its March 2008 levels and gold poised to surpass $1,000 an ounce, profit margins for gold miners are ready to go through the roof.”
Source: Casey's Charts , February 24, 2009.
Financial Times: Japanese production falls record 10%
“Japanese manufacturing output in January plunged a record 10% month-on-month and new job offers declined 18%, reflecting the deepening recession in the world's second largest economy.
Industrial production was down a whopping 30.8% year-on-year, as manufacturers of vehicles, electronics parts and devices and general machinery slashed output to adjust to the rapid fall in global demand.
“‘I am very concerned that you are laying the groundwork for a deflationary environment,' he said.
“The grim figures underscore the impact of sharply falling demand in Japan's main markets, particularly, the US.
“Japanese exports slumped a record 45.7 per cent in January.
“However, domestic consumption has also been hit, with household spending in January falling a faster-than-expected 5.9% month-on-month, following a 3.7% drop in December.
“‘This is not a one-quarter phenomenon with a V-shaped recovery. The weakness is likely to persist for at least another one to two quarters,' Mr Richards said.”
Source: Michiyo Nakamoto, Financial Times , February 27, 2009.
Bloomberg: East European economies seek $230 billion aid
“Hungarian Prime Minister Ferenc Gyurcsany wants the European Union to arrange a package of as much as 180 billion euros ($230 billion) to help east European economies, banks and companies weather the financial crisis.
“The proposal, along with a pledge of 24.5 billion euros from the World Bank and two other international organizations for east Europe's banks and businesses, helped push up currencies and stocks in the region.
“The global credit crisis that has left banks with more than $2 trillion in losses and writedowns and triggered a simultaneous recession in the euro region, the US and Japan, is taking its toll on emerging economies as demand for their exports collapses and investment evaporates. Hungary, Ukraine, Latvia, Serbia and Belarus needed international bailouts to avert defaults as they struggle to refinance short-term debt.
“‘We must reduce the region's risk and that won't happen with words alone,' Gyurcsany, 47, said in an interview in Budapest yesterday. ‘The EU must take a lead role. This package can surely stop the quick depreciation of national currencies, which is the biggest risk in the region right now. We must raise awareness of the region's challenges and build a framework for coordinated action.'
“A ‘European Stabilization and Integration Program' would include short-term financing for governments, coordinated restructuring for private debt, the recapitalization of banks and liquidity for companies in as many as 12 countries, Gyurcsany said. He will present the plan at a March 1 EU summit in Brussels.
“The program would aim to help EU members Bulgaria, the Czech Republic, Estonia, Hungary, Latvia, Lithuania, Poland and Romania; two non-EU states, Croatia and Ukraine; and two euro-region economies, Slovakia and Slovenia, Gyurcsany said.
“Within the program announced today by the international lenders, the European Bank for Reconstruction and Development will provide about 6 billion euros over two years, the European Investment Bank, the EU's lending arm, about 11 billion euros and the World Bank about 7.5 billion euros. The aid will take the form of equity and debt financing, credit lines and political risk insurance.”
Source: Balazs Penz and Agnes Lovasz, Bloomberg , February 27, 2009.
Rainer Singer (Erste Group): Central Europe fears overdone
“Central and eastern European (CEE) economies are undoubtedly suffering a sharp slowdown - but fears that the region is heading for a crash are unjustified, says Rainer Singer, co-head of fixed income and macro research at Erste Group.
“He says the source of CEE growth was high productivity gains, backed by foreign investment, rather than irresponsible accumulation of debt, which many fear will neither be repaid nor refinanced.
“Mr Singer acknowledges that CEE indebtedness has grown but says repayment capability is still in place.
“He says: ‘Overall, the region's debt level, excluding the financial sector, is low, varying from 35% of GDP in Romania to 104% in Latvia. That compares with 136% in EMU as a whole and 288% in the UK. External debt rates also differ hugely - from 40% of GDP in the Czech Republic to 127% in Hungary. In EMU, the rate is 175% and in the UK 370%.'
“Weaker CEE currencies will affect debtors with foreign currency loans, but recent wage growth makes it more likely that households will service higher debt costs, he says.
“‘Intercompany loans, both domestically and between eurozone and CEE entities - which comprise a big part of external debt - reduce refinancing difficulties.
“‘Since western European companies will support those subsidiaries with the lowest unit labour costs and most attractive growth prospects, CEE will return as Europe's growth engine.'”
Source: Rainer Singer, Erste Group (via Financial Times ), February 25, 2009.
Did you enjoy this post? If so, click here to subscribe to updates to Investment Postcards from Cape Town by e-mail.
By Dr Prieur du Plessis
Dr Prieur du Plessis is an investment professional with 25 years' experience in investment research and portfolio management.
More than 1200 of his articles on investment-related topics have been published in various regular newspaper, journal and Internet columns (including his blog, Investment Postcards from Cape Town : www.investmentpostcards.com ). He has also published a book, Financial Basics: Investment.
Prieur is chairman and principal shareholder of South African-based Plexus Asset Management , which he founded in 1995. The group conducts investment management, investment consulting, private equity and real estate activities in South Africa and other African countries.
Plexus is the South African partner of John Mauldin , Dallas-based author of the popular Thoughts from the Frontline newsletter, and also has an exclusive licensing agreement with California-based Research Affiliates for managing and distributing its enhanced Fundamental Index™ methodology in the Pan-African area.
Prieur is 53 years old and live with his wife, television producer and presenter Isabel Verwey, and two children in Cape Town , South Africa . His leisure activities include long-distance running, traveling, reading and motor-cycling.
Copyright © 2009 by Prieur du Plessis - All rights reserved.
Disclaimer: The above is a matter of opinion and is not intended as investment advice. Information and analysis above are derived from sources and utilizing methods believed reliable, but we cannot accept responsibility for any trading losses you may incur as a result of this analysis. Do your own due diligence.
Prieur du Plessis Archive |
© 2005-2022 http://www.MarketOracle.co.uk - The Market Oracle is a FREE Daily Financial Markets Analysis & Forecasting online publication.