


Stock Market Downward Spiral Continues
Stock-Markets / Stocks Bear Market Mar 01, 2009 - 05:03 AM GMT

 So long, November lows. Last week, the news media, always looking for a headline, were quick to point out the Dow Theory Sell Signal that occurred last week. Of course, there were plenty of analysts that came out of the woodwork to proclaim the Dow Jones Industrial and Transportation Averages as irrelevant indexes, and therefore Dow Theory had no great impact on the market. Since then, the DJIA now sits 7 percent below its November low after only a week and the S&P 500 is now below its November low. The Nasdaq is not far behind. It looks like the Dow Theorists may be right. Sadly, there are not many signs pointing to an improving market.
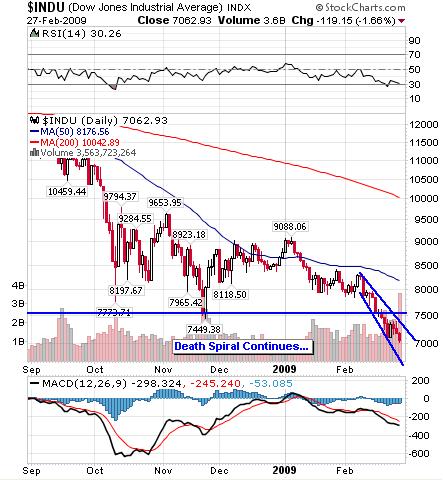
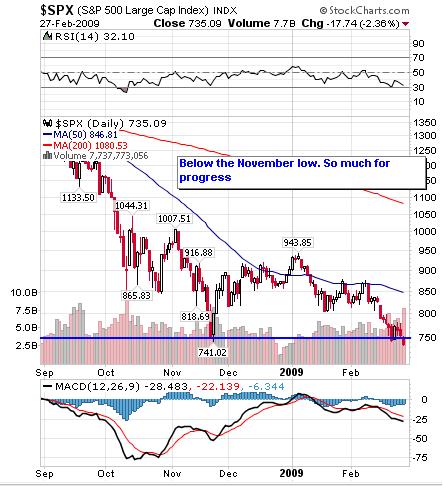
The stock market certainly did not handle the news of the Federal Governments taking a stake in Citigroup very well. This is a bad sign. As was the case in over the last few months, the market shrugged off bad news- normally a sign that rock bottom had been hit. This time, there was no rally on the Citigroup news, even considering that the rumor was circulating for some days. Rather, the DJIA and S&P 500 lost 1.66 and 2.36 percent, respectively.
Currently, the DJIA now faces resistance at the November low in the 7550 area. It has support in the 7000 area. A fall below this level will likely trigger massive selling.
The S&P 500 not only fell below the closing November low but its intraday low as well. The aforementioned lows are now resistance.
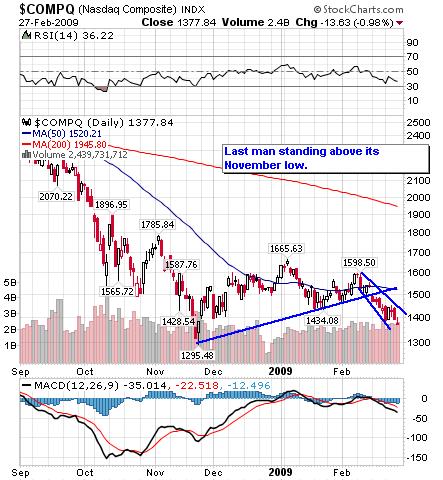
The Nasdaq is the last index standing. It currently has support at 1295 and resistance in the 1430 area. Based on the recent market conditions, it will likely joins its compatriots below their November lows.
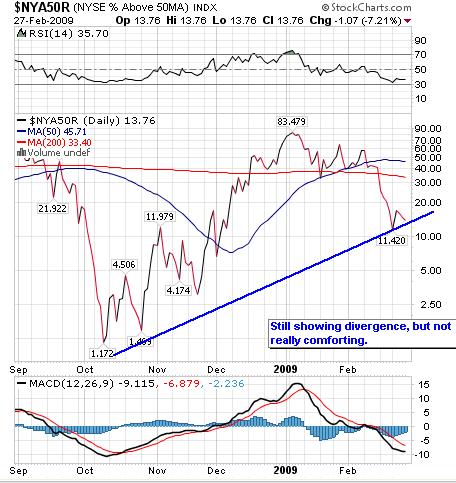
There is still divergence occurring in the market. Currently, 13.76% of stocks are above their 50 day moving average. This is higher than in November, when it stood at 1.17%. Divergence, yes, but is certainly not comforting. Divergence between indicators may appear on the charts, but it may take time for the trend to change.
The bottom line is that the downtrend is still intact. If you are long, you are playing with fire. Now is not the time buy stocks. Period.
By Kingsley Anderson
http://tradethebreakout.blogspot.com
Kingsley Anderson (pseudonym) is a long-time individual trader. When not analyzing stocks, he is an attorney at a large law firm. Prior to entering private practice, he served as a judge advocate in the U.S. Army for five years and continues to serve in the U.S. Army Reserves. Kingsley primarily relies on technical analysis to decipher the markets.
Kingsley's website is Trade The Breakout (http://tradethebreakout.blogspot.com)
Copyright © 2009 Kingsley Anderson - All Rights Reserved
Disclaimer: The above is a matter of opinion provided for general information purposes only and is not intended as investment advice. Information and analysis above are derived from sources and utilising methods believed to be reliable, but we cannot accept responsibility for any losses you may incur as a result of this analysis. Individuals should consult with their personal financial advisors.
Kingsley Anderson Archive |
© 2005-2022 http://www.MarketOracle.co.uk - The Market Oracle is a FREE Daily Financial Markets Analysis & Forecasting online publication.