


Stock Market Battling Between Negative and Positive Divergences
Stock-Markets / Stock Index Trading Feb 26, 2009 - 09:47 AM GMTBy: Marty_Chenard

 Can a market positive and a market negative coexists at the same time?
The answer is: For a short period of time.
What you are describing when you discuss such conditions are "conflicting market conditions". Conditions where there is a "force in one direction" being opposed by a "force from another direction".
When the power of each of these forces is equal, there is a "standoff" where neither force has the advantage. Until one of the forces establishes the dominant position, the situation is a neutral standoff.
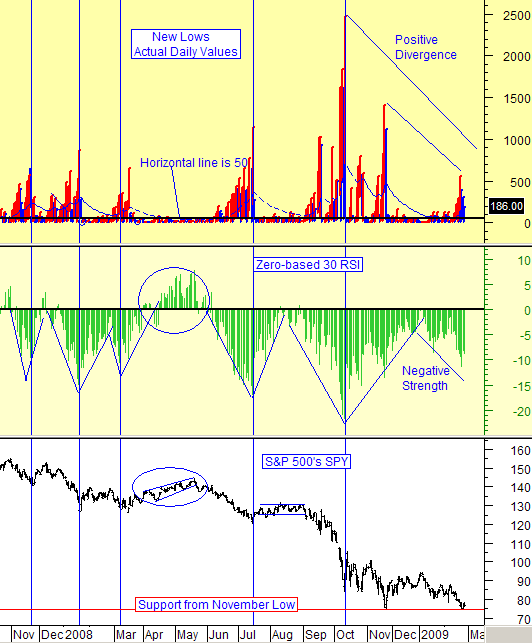
Let's look at such an example today. Such a "conflicting market condition" shows up when we look at our chart of New Daily Lows on the New York Stock Exchange along with our zero-based Relative Strength for the S&P 500.
This is a fascinating chart because it shows that the S&P 500 is now at a major testing point. The S&P has recently dropped down to a level that necessitates retesting the November low. The S&P has not broken below the support, or rallied yet because ...
Because ... Just as this is happening, there are "conflicting market conditions" where opposing forces are offsetting each other. Each is holding the other back from a rally or from a descent down further.
Notice what is happening on this chart.
First, the New Lows peaked in October. The New Lows were then followed by a lesser rise in November while the market made a new low on the S&P. That was a positive divergence, where the market rose from there ... only to fall back down to retest the S&P low again. But notice how, once again, the New Lows have a Positive divergence ... and this time, the divergence is more positive than the last time. So, we have a "positive force" acting on the market.
Second, look at our Relative Strength for the S&P 500. Note that the Strength for the S&P 500 is negative. Also, note that the short term trend has been moving lower. So, here we have a "negative force" in play. (Some of you may also observe that the Relative Strength also has a positive divergence when you look at the October to February time period. However, the dominant force on the Strength is a down force because it has recently made a lower/low .)
Summing up the two, you have one positive and one negative force ... a standoff as a battle of the forces fight for dominance. It isn't until such divergent forces "clear themselves off the table", that the stock market is able to establish a direction for the next trend. (The update of this chart can be seen every day on our paid subscriber site.)
________________________________________________
*** Feel free to share this page with others by using the "Send this Page to a Friend" link below.
By Marty Chenard
http://www.stocktiming.com/
Please Note: We do not issue Buy or Sell timing recommendations on these Free daily update pages . I hope you understand, that in fairness, our Buy/Sell recommendations and advanced market Models are only available to our paid subscribers on a password required basis. Membership information
Marty Chenard is the Author and Teacher of two Seminar Courses on "Advanced Technical Analysis Investing", Mr. Chenard has been investing for over 30 years. In 2001 when the NASDAQ dropped 24.5%, his personal investment performance for the year was a gain of 57.428%. He is an Advanced Stock Market Technical Analyst that has developed his own proprietary analytical tools. As a result, he was out of the market two weeks before the 1987 Crash in the most recent Bear Market he faxed his Members in March 2000 telling them all to SELL. He is an advanced technical analyst and not an investment advisor, nor a securities broker.
Marty Chenard Archive |
© 2005-2022 http://www.MarketOracle.co.uk - The Market Oracle is a FREE Daily Financial Markets Analysis & Forecasting online publication.