


Stocks Bear Market Uncanny Parallels to 1929 Crash
Stock-Markets / Stocks Bear Market Feb 25, 2009 - 07:33 AM GMTBy: MoneyWeek

 The stock market crash of 2008 played out like 1929 almost to the day. In fact the pattern was so uncannily close, that I became convinced the post-crash rebound would do the same and we would see a similar spring bounce.
That hasn't happened. After a brief rally into 2009, the markets have ground lower. But now they are at key levels. A breakdown from here and things are going to get even nastier – if such a thing were possible...
The uncanny parallels between 2008 and 1929Let's take a look first at the repeating pattern of stock market crashes. My thanks to Bob Hoye of Institutional Advisers for the table. You can see the similarities are amazing:
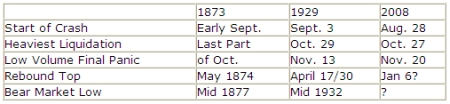
Moreover, the percentage declines were virtually identical. An initial decline from the high to a late October low of about 40%, then a rebound of about 15%, followed by a final low in late November – down about another 22%. The parallels are uncanny.
The worrying thing for today's investors is that the final low after 1929 did not come until three years later; after 1873 it did not arrive until four years later. Given that modern markets made their peak in mid-2007 it is not unreasonable to expect the eventual low to come no earlier than 2010-11.
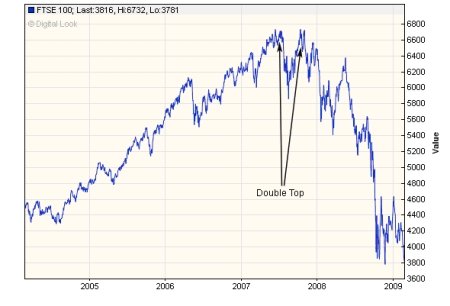
What is a double top and why is it so important?Stockcharts.com, the website of lauded technical analyst John Murphy, defines a ‘ Double Top ' as follows: ‘a major reversal pattern that forms after an extended uptrend. As its name implies, the pattern is made up of two consecutive peaks that are roughly equal, with a moderate trough in-between'.
The thinking behind the double top (and indeed its opposite, the double bottom) is that the market reaches a point where there are no more buyers, only sellers. It falls, then retests that point, and when there are still no more buyers, it reverses. The FTSE 100 – and every other major index – put in a clear double top in 2007 (just as they did in 2000) and it signalled a significant change in trend (see chart below):
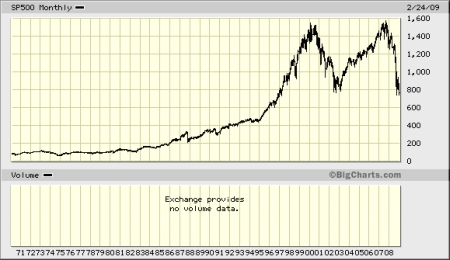
That is just a weekly chart for the last five years. What is worrying, however, is if you look at the bigger picture. The major indices have put in a mammoth, long-term double top. Here is a chart of the S&P since 1970. You can see it very clearly in the chart below – in 2007, at the 2000 highs, the markets ran out of buyers:
But you can also see, the market is now retesting those 2002-3 lows. They were first tested in November 2008 and we got a rally. Now they're being retested again (see below):
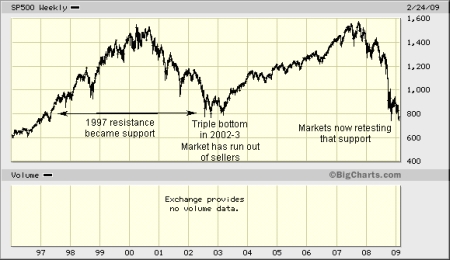
This really is a key juncture for the stock markets. If these lows hold, we could be marking an important bottom (although I have no doubt this will be retested).
But if we break down below these lows, we're going back to test 1996 prices (600 on the S&P) and possibly even 1994 prices (S&P around 450). These current lows will then mark an important point of resistance that will slow any future bull markets (in other words, when markets rise again, the current lows will be where they start to falter).
On the positive side, Bloomberg reported this week that Elliot Wave International's Robert Prechter, a notorious bear and practitioner of ‘Wave theory', has advised his clients to cover their shorts (bets that the market will fall). He first recommended that his clients short US stocks in 2007, saying that “aggressive speculators should return to a fully leveraged short position.” But Prechter wrote to his clients this week, saying that “the market is compressed. When it finds a bottom and rallies, it will be sharp and scary for anyone who is short. I would rather be early than late.”
My own thinking is that we will see some kind of support and possibly even a rally from the mid-700s. But, longer-term, this bear market is far from over.
And what about gold?Prechter has been right about a lot of things – deflation being one of them – but he has not been right on gold. A strong deflationist, he has been bearish on the metal. But we are rapidly learning that gold is first and foremost a monetary metal – and as money is the best asset to own during deflation, it's actually doing rather well.
Now, I hope that Prechter remains wrong. But the worrying thing for gold investors now is that gold, too, is putting in a double top.
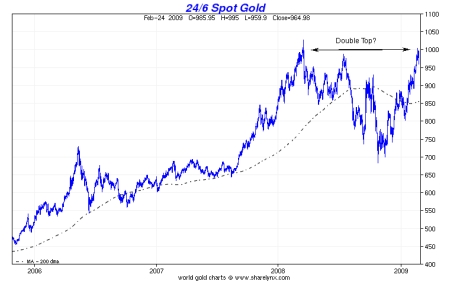
$1,000 an ounce was such an obvious place for gold to hit resistance. As I wrote in last week's Money Morning , it made sense to take some money off the table. I remain convinced of gold's long-term future, but it looks like we are in the early stages of an intermediate correction.
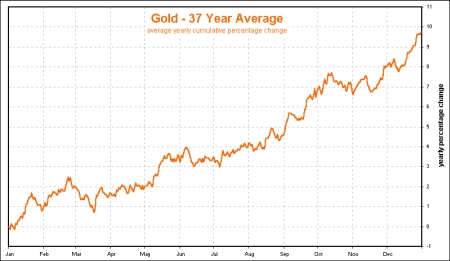
I suppose a 50% retracement of the gains since October is not an unreasonable target. That would take us back to the $850 area. (It would also give us a superbly bullish, inverted head-and-shoulders pattern – more on that another day). I said in my new year predictions in MoneyWeek that a retest of $1,000 was likely in the first part of the year, but that gold would not break through $1,000 until next autumn or winter. We still seem to be on course for that. For now though, the late February to March seasonal correction for gold (see chart below) is playing out to the script:
I couldn't bring myself to sell any gold or any of my preferred gold stocks, so instead the way I played this was to buy some puts (options that bet the price will go down) on SLV (the silver ETF), and GDX (the gold stocks ETF). It's been a good trade so far.
By Dominic Frisby for Money Morning , the free daily investment email from MoneyWeek magazine .
© 2009 Copyright Money Week - All Rights Reserved
Disclaimer: The above is a matter of opinion provided for general information purposes only and is not intended as investment advice. Information and analysis above are derived from sources and utilising methods believed to be reliable, but we cannot accept responsibility for any losses you may incur as a result of this analysis. Individuals should consult with their personal financial advisors.
Money Week Archive |
© 2005-2022 http://www.MarketOracle.co.uk - The Market Oracle is a FREE Daily Financial Markets Analysis & Forecasting online publication.