


Gold Market Outlook – how far is down?
Commodities / Gold & Silver Stocks May 01, 2007 - 11:15 PM GMTBy: Peter_Degraaf
 While it is next to impossible to pick the exact tops and bottoms, there are some signs we can look for to help us position ourselves to buy into weakness, and do some selling into strength.
In view of the fact that the fundamentals for gold remain very bullish, (growing demand – diminishing supply), we do not need to let corrections bother us, for they will afford us with many opportunities to ‘add-on', for a number of years to come.
Charts courtesy of www.stockcharts.com
Featured is the HUI index of unhedged mining stocks. I expect the first clue that the metals and mining stocks are ready to turn back up, to come from this index. The red arrows are targets which may or may not be hit, they are simply ‘targets'.
The black lines are ‘top to bottom' ranges. ‘A' measures 75 mm; ‘B' = 60 mm; ‘C' = 38 mm; ‘D' = 33 mm. In the event that ‘E' stops at the 330 target (right at the 200DMA), the ‘top to bottom' range will be 26 mm, and if ‘E' does not stop until 320, the range will be 30 mm. The positive progression in the ‘top to bottom' ranges from A to D, causes me to expect a bottom fairly soon, with the ‘top to bottom' range for ‘E' to be less than ‘D' or less than 33 mm.
Since I am not pretending to be God (who alone does know the future), here is what I will be looking for, at or near those two red arrow targets at 320 and 330, to tell me that the HUI is turning back up again.
• Two successive closes above the high point in the range of the previous day. Or
• An ‘upside reversal' (price first goes below the low of the previous day, but closes above the close of the previous day).
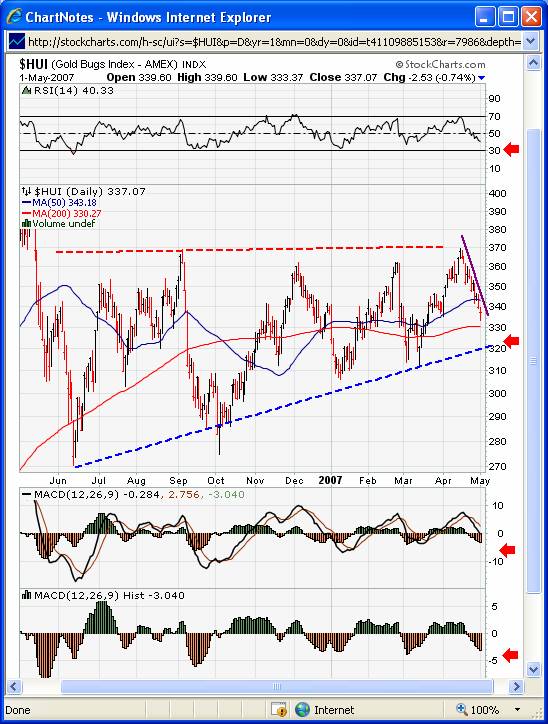
Here is another look at the same chart. Notice the blue dashed uptrend line which is carving out a positive Advancing Right Angled Triangle.
Here also, these red arrows are targets that are now close to being hit.
The purple down-trending line indicates short-term resistance. Once we see two positive closes to the right of that line, we can be fairly sure that the next up-cycle is underway.
ARAT's most often break out on the upside, especially so the closer we come to the apex. The breakout at 370 will likely be powerful. Patience is all we need in the interim.
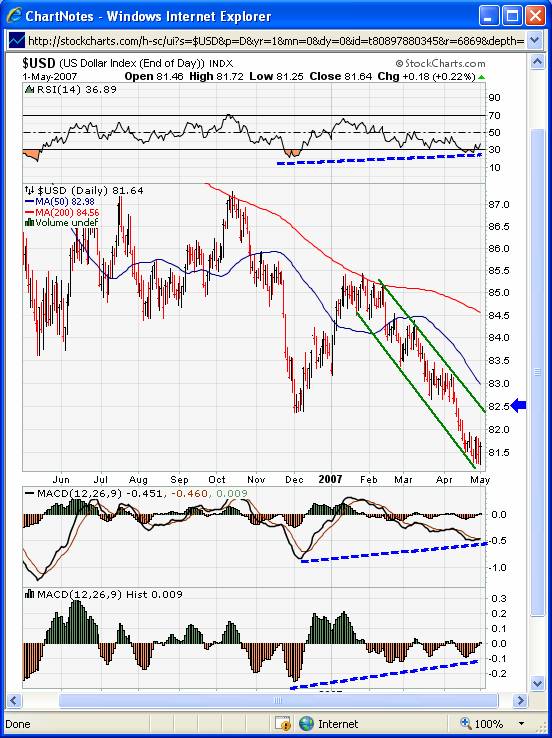
Featured is the US dollar index. For the past four months the green ‘speed lines' have contained the slide. The three ‘confirming indicators' (blue dashed lines), are telling us (by ‘non-confirming), that we should expect a few days (weeks?) of a rise in this index, which will likely prevent the metals from rising until this index nears the target at 82.50 (blue arrow).
Happy trading!
By Peter Degraaf.
Peter Degraaf is an online stock trader with over 50 years of metals trading experience. He sends out a weekly E-mail to his many subscribers. For a 60 day free trial, contact him at ITISWELL@COGECO.CA
DISCLAIMER: Please do your own due diligence. I am NOT responsible for your trading decisions.
© 2005-2022 http://www.MarketOracle.co.uk - The Market Oracle is a FREE Daily Financial Markets Analysis & Forecasting online publication.