Ineffective Alphabet Soup Policy Could Trigger Deflation Scare
Stock-Markets / Financial Markets 2009 Feb 24, 2009 - 02:55 AM GMTBy: Captain_Hook

 The markets are falling apart much faster than originally anticipated, which is troubling with respect to the inflation case. This is why we highlighted the scary reversals in M1 and M3 growth rates earlier in the week, to alert you to the possibility conditions might progress such that general price weakness could develop moving forward. While it's true such discussion might be premature, and it would take time for such reversals to have lasting effect, never the less, it's disturbing to see money supply trends possibly turning down at this time with a major sell signal in the stock market now in the bag. (This comment was updated for your benefit.)
The following is an excerpt from commentary that originally appeared at Treasure Chests for the benefit of subscribers on Thursday, February 5th, 2009.
Of course I am referring to the potential sell signal that would be triggered with a Dow Theory ‘bear market confirmation' that would be triggered with a move through 7552. If this were to occur, then the expectation would be an accelerated decline in the Dow would ensue, with up to a 40% loss from present levels possible off this signal. In this regard, if such an outcome were to occur with supportive seasonals and internals at this time, the message would be particularly ominous, increasing the likelihood severe losses should be anticipated as the summer doldrums approach.
So, it's understandable why precious metals are holding up so well in spite of short-term bearish sentiment and technical factors. To be fair however, it should be noted that generally the charts point to future gains, potential gains that should be viewed in an intermediate context, allowing for further upside from here sparked by a flight to safety. Here, capital from both the stock and bond markets might be looking for a new home on an increasing basis for various reasons moving forward, complicating expectations with respect to precious metals performance.
In order to provide you with an appropriate picture of just where things stand technically in the precious metals market at this time, it appears a trip to the Chart Room is in order. Before we look at any pictures however, and to establish the proper perspective it should be understood that despite numerous reasons we can find to support the view a pullback is likely right now (sentiment, the count, money supply growth reversal, seasonals, deleveraging, etc.), we can find others that support further gains as well, which is clouding the picture. Let me show you what I mean.
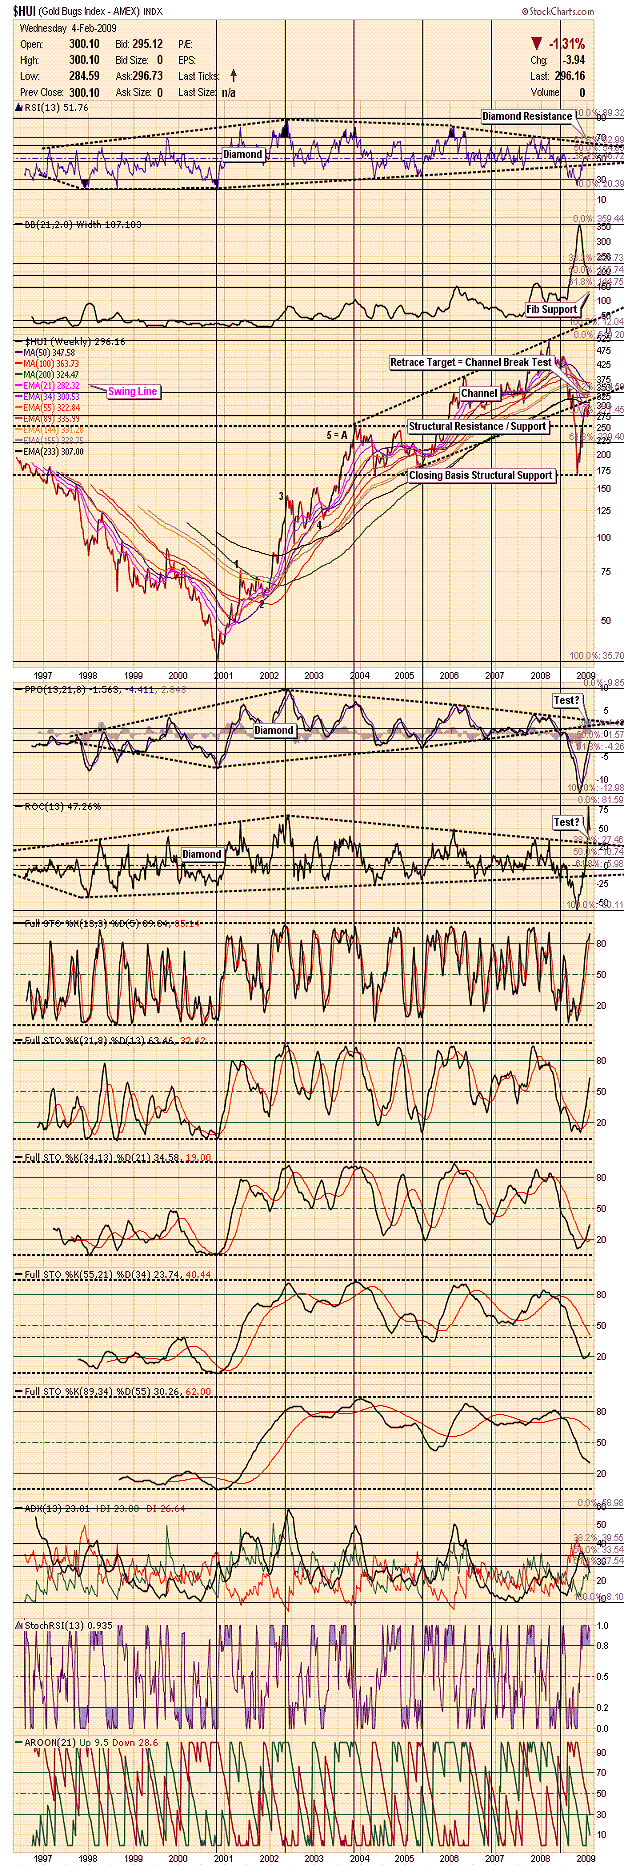
The first chart is a weekly Amex Gold Bugs Index (HUI) snapshot, showing that on a closing basis the channel break test we have been anticipating since the November lows is for all intents and purposes ‘complete'. That being known, common sense is suggestive a pullback is in order to gain steam this being the first attempt to punch back up into an accelerated growth trajectory. Thus, we would not be a bit surprised to see precious metals shares weaken any time now from this perspective. (See Figure 1)
Figure 1

Note: Notice I have not labeled the B-wave above yet, because it might not be over. In this respect it's my opinion the entire three-wave advance and correction from 2004 to present is a running correction.
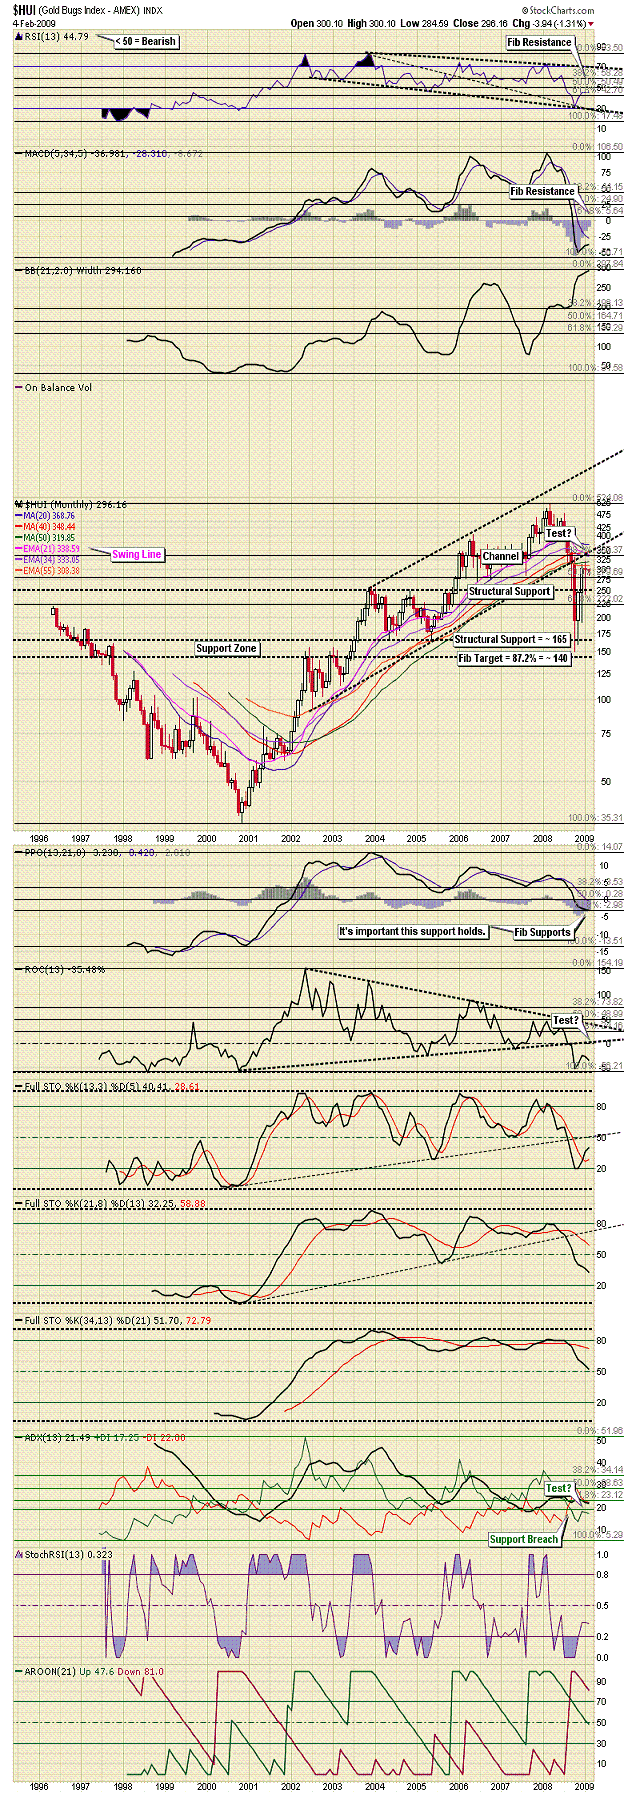
Further to this, and in understanding insufficient negative sentiment with respect to precious metals shares exits to maintain a squeeze higher (see Figures 12 and 13 ), as can be seen both above and below, despite this condition set, further marginal gains appear possible based on bullishly predisposed indicators, with channel resistance on the monthly HUI closer to 335 than recent highs that vexed the 310 to 320 area. (See Figure 2)
Figure 2

From this perspective it's important to understand a vexing of the monthly swing line (21-exponential moving average [EMA]) now at 338 may be appropriate before the larger degree bounce is complete considering it was the break of this key support at the top that marked the onset of last year's crash. Thus, one should not be surprised if the little pennant traders have been tracing out (seen here on the daily ) over the past few days resolves to the upside. (See Figure 3)
Figure 3

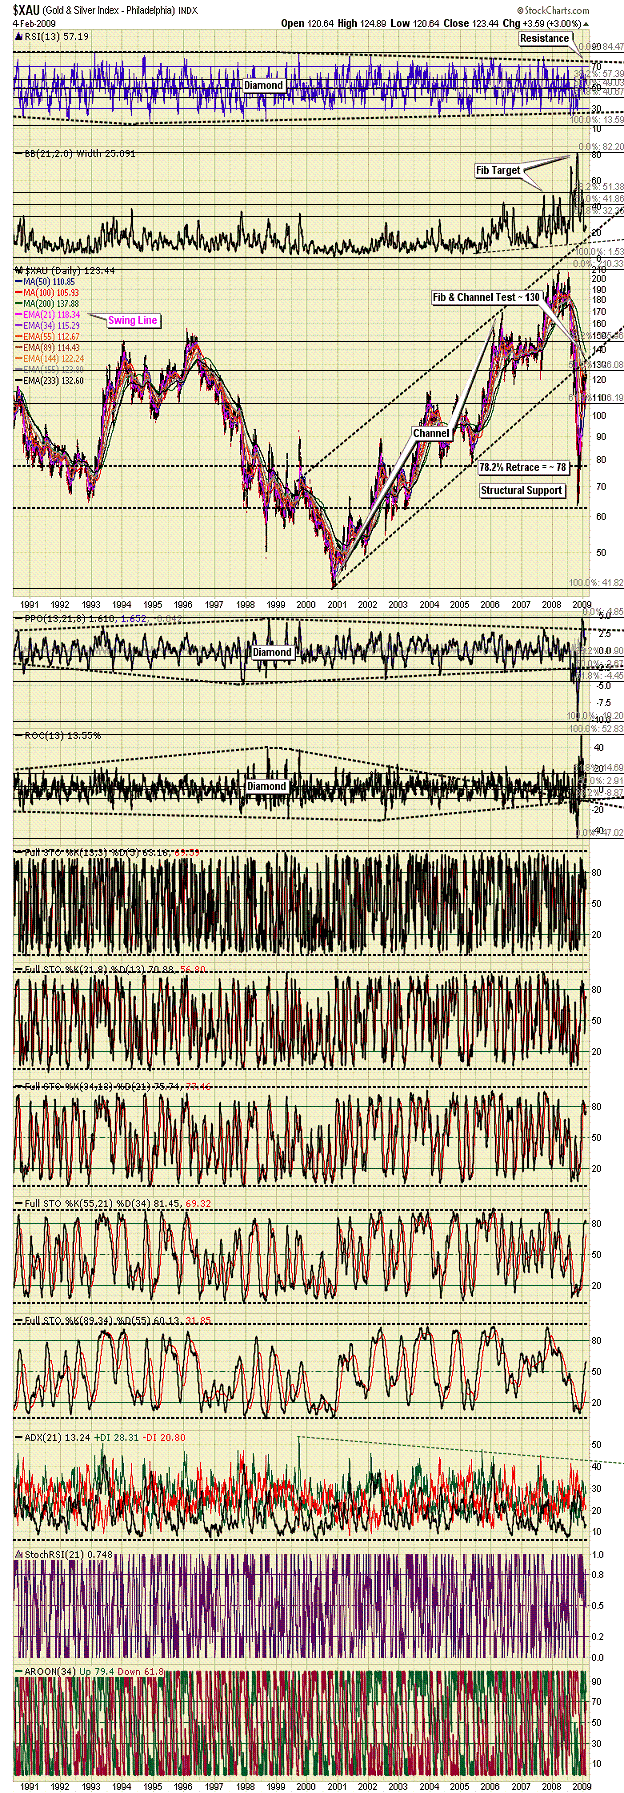
Again however, if the primary message found on the daily Philadelphia Gold And Silver Index (XAU) plot has any predictive value, a channel test should halt substantial further progress prior to a larger degree corrective sequence taking hold. Of course if the bullish appearance of stochastic settings on the weekly have anything to say about it, precious metals shares should cut through such resistance with little concern, on their way to test higher channel related resistance in the 140 area. (See Figure 4)
Figure 4

One should note this would correspond to a test of the monthly swing line at the 21 EMA, corresponding to the same set-up on the HUI. What is demonstrated in more profound fashion on the monthly however is the presence of significant Fibonacci related resistance in the 145 area that provides a double wall of resistance to get through. One would think better sentiment / liquidity related conditions would need be present for such daunting resistance to be penetrated at this point, especially on the first attempt. (See Figure 5)
Figure 5

Good investing all.
By Captain Hook
http://www.treasurechestsinfo.com/
Treasure Chests is a market timing service specializing in value-based position trading in the precious metals and equity markets with an orientation geared to identifying intermediate-term swing trading opportunities. Specific opportunities are identified utilizing a combination of fundamental, technical, and inter-market analysis. This style of investing has proven very successful for wealthy and sophisticated investors, as it reduces risk and enhances returns when the methodology is applied effectively. Those interested in discovering more about how the strategies described above can enhance your wealth should visit our web site at Treasure Chests
Disclaimer: The above is a matter of opinion and is not intended as investment advice. Information and analysis above are derived from sources and utilizing methods believed reliable, but we cannot accept responsibility for any trading losses you may incur as a result of this analysis. Comments within the text should not be construed as specific recommendations to buy or sell securities. Individuals should consult with their broker and personal financial advisors before engaging in any trading activities, as we are not registered brokers or advisors. Certain statements included herein may constitute "forward-looking statements" with the meaning of certain securities legislative measures. Such forward-looking statements involve known and unknown risks, uncertainties and other factors that may cause the actual results, performance or achievements of the above mentioned companies, and / or industry results, to be materially different from any future results, performance or achievements expressed or implied by such forward-looking statements. Do your own due diligence.
Copyright © 2009 treasurechests.info Inc. All rights reserved.
Unless otherwise indicated, all materials on these pages are copyrighted by treasurechests.info Inc. No part of these pages, either text or image may be used for any purpose other than personal use. Therefore, reproduction, modification, storage in a retrieval system or retransmission, in any form or by any means, electronic, mechanical or otherwise, for reasons other than personal use, is strictly prohibited without prior written permission.
Captain Hook Archive |
© 2005-2022 http://www.MarketOracle.co.uk - The Market Oracle is a FREE Daily Financial Markets Analysis & Forecasting online publication.


