Financial Markets at Critical Juncture
Stock-Markets / Financial Markets 2009 Feb 23, 2009 - 05:30 AM GMTBy: Brent_Harmes

 Two roads diverged in the markets, and I... I didn't care, because I owned precious metals. This has to be the most amazing time to be alive. I believe that the changes that will play-out over the next few years will dwarf anything that has come before, and this week will be one of the decisive moments. All the major financial indicators that often foretell the short-term direction of the markets, the economy, and the general feeling of optimism or fear and gloom, are at a critical juncture. Gold, the DOW, the S&P 500, and the US dollar are all at key turning points and the direction which the markets will head for the short term should be decided this week.
Many analysts think the stock markets will bounce and the dollar will continue its rally while precious metals do one last pullback, while many more think the stock markets will plunge, gold will soar, and the dollar will be toast. Of course over the long haul the latter group will be right, but I don't really care because I own gold and silver. My metals not only give me a feeling of safety and of being protected, but also a great sense of optimism and well-being because I know that, over the long term, I will do very, very well, regardless of what the next few months bring.
I usually don't do technical analysis because it is only right 60% of the time... which means that it's wrong 40% of the time. Virtually every time I made a trade or investment based on the advise of a technical analyst, I have ended up in the 40% camp, with the short end of the stick. I now make my investment decisions solely on the fundamentals because the fundamentals always, always prove themselves out over time and the fundamentals have still never looked better for gold and especially silver. The only problem with betting on the fundamentals is that no one knows how long they will take to play out, and it's usually a lot longer than anyone thinks. But lately I'm getting the feeling it's going to be sooner, rather than later.
Anyway, here goes a look at this weeks amazing technicals.
Here is a chart of the DOW showing the last two years of price action. Last Wednesday and Thursday, February 18th and 19th, the DOW closed just above its November low of approximately 7500, forming a pattern that traders and technical analysts call a double-bottom. This is the decision point. Either the market bounces and starts a significant rally, or the bottom is breached and the bear market continues... either way the move is usually large and dramatic.
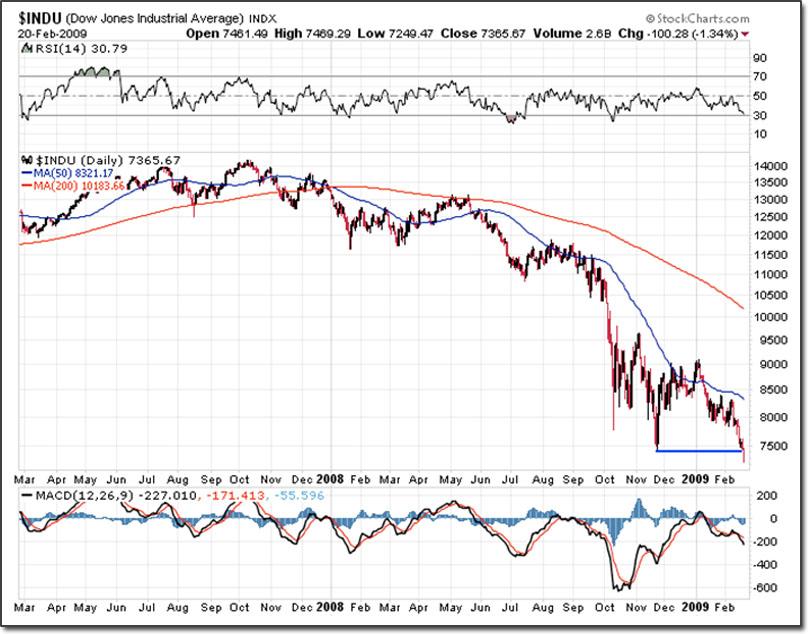
Then on Friday, the DOW pierced the previous low and fell to 7,250. Though this is extremely bearish, the other indices still haven't made the same decision. If the other indices would pierce their lows this would confirm the DOW, but the DOW has only pierced its low by little more than 1%... 3% would be much more decisive, so this bears careful watching. The 50 day moving average (blue line) and the 200 day moving average (red line) are very far apart, suggesting a further rest or a rally would be in order. HOWEVER, As far as the technical indicators go (the small graphs above and below the main graph), the RSI indicator (top of chart) is still not in deeply oversold territory and the MACD (bottom of chart) is still bearish, so there is still the possibility of a further decline or even a continuation of the crash.
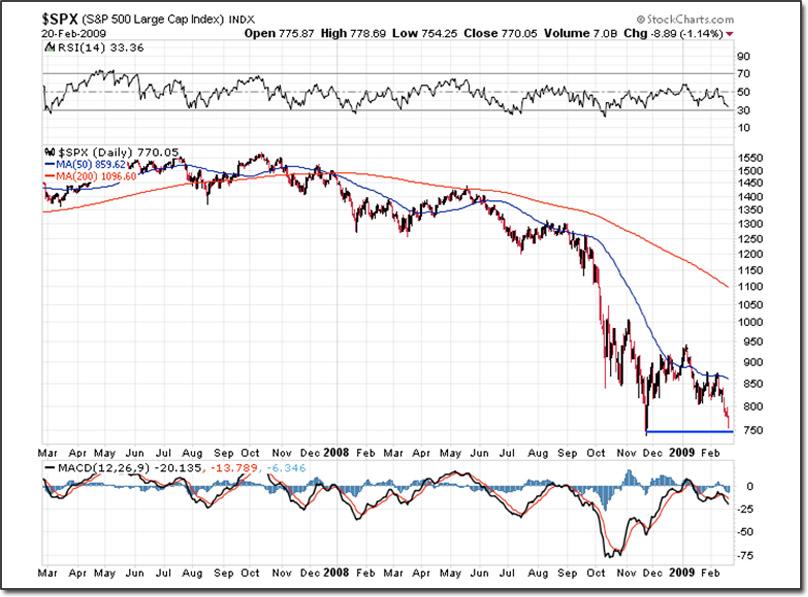
The two year chart of the S&P 500 also shows it putting in a double bottom, and it shares all the same characteristics with regards to the indicators, but it still needs to close below its previous low of approximately 750 to confirm the DOW.
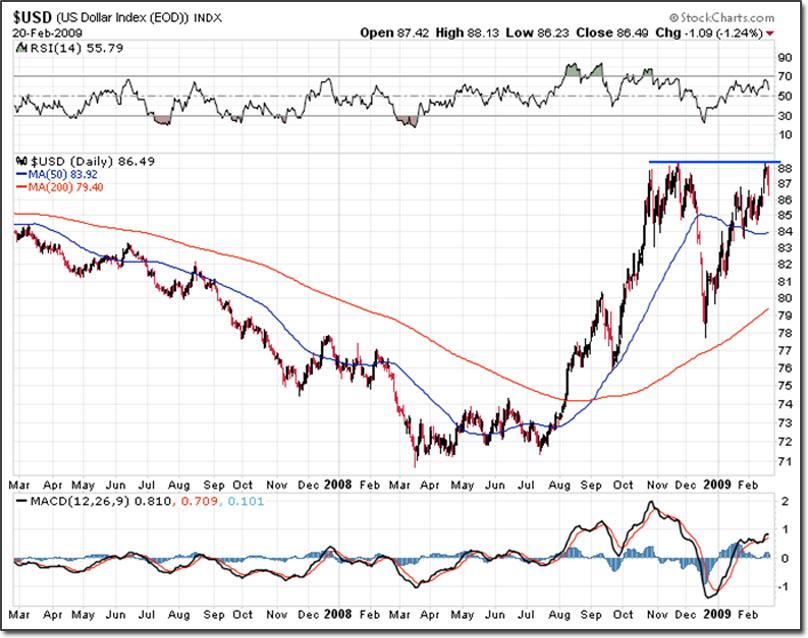
This two-year chart of the U.S. dollar also shows that it is at the same critical juncture, having just put in a double top at around 88 on Thursday, and a pullback of a little more than 1% on Friday.
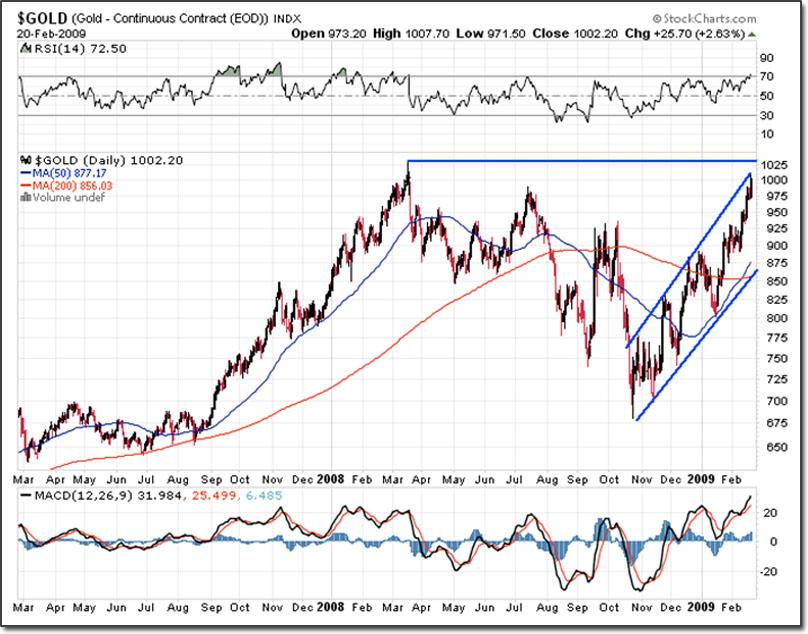
Next we have the chart you've been waiting for... gold. Gold has been in an up-trending channel since November of last year, and is now poised to break out of both the channel, and above its previous high of $1,030. If it does, then it's "off to the races" for the metals. But like I said, many analysts think gold will do one last pullback. It is sitting at the top of its trend channel and just below its previous high... these two factors taken at the same time create a very strong resistance point. If the DOW recovers and the dollar continues its rally, then gold should definitely pull back. To be honest, this is what I'm hoping for... a little more time to get prepared, and one last chance to buy three-digit gold and silver in the low teens.
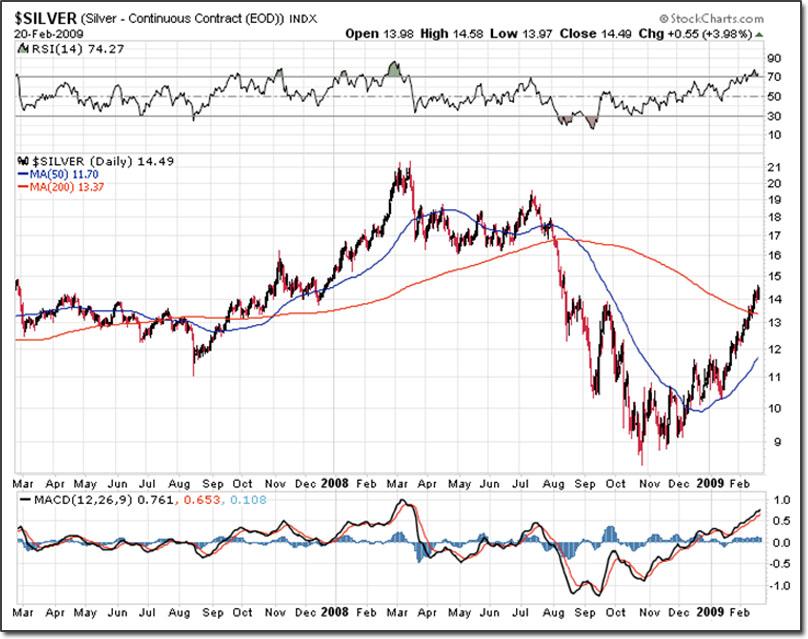
Speaking of silver, it has been running long and hard since January and looks overdue for a pullback. The RSI is in overbought territory and the moving averages are still in a bearish alignment, however, the MACD remains bullish.
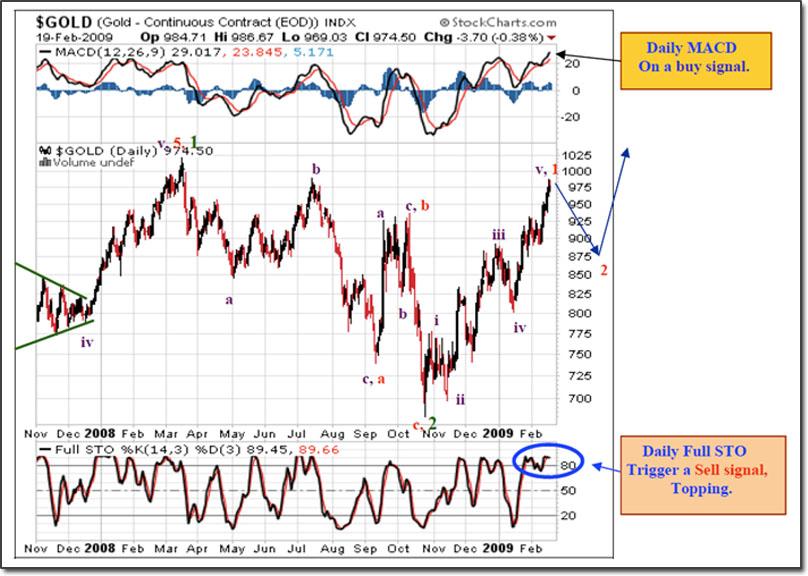
As I said, there are more than a few analysts who are predicting a pullback. Here are two that I have great respect for... Robert D. McHugh of https://www.technicalindicatorindex.com/ and Matthew Fraley of http://www.breakpointtrades.net . Both use multiple forms of technical analysis including something called Elliott Wave.
The first chart is from Robert McHugh. The chart spans a little more than a year, and shows the pullback he is predicting taking a few months and giving us a price pullback into the high $800s.
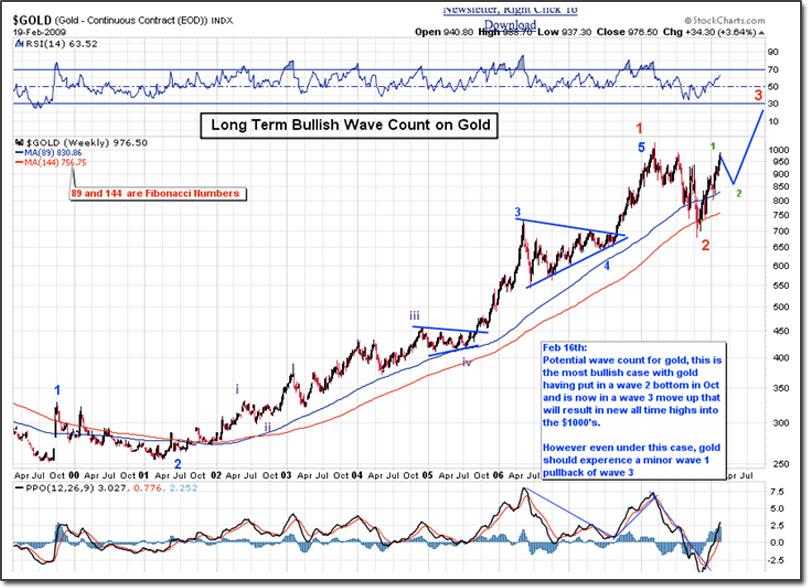
The next chart is from Matt Fraley. I saved this chart for last because it shows the big picture. It is a 10-year chart of gold showing the entire bull market beginning from the powerful double bottom that gold put in, in 1999 and 2001. As you can see, Matt also is expecting a pullback in gold over the next few months, back to possibly the $850 area.
But there is something else that I see if Matt and Robert's scenarios play out. The pullback will create the right shoulder of an inverse "head and shoulders" pattern. This is an extremely bullish pattern and it would predict a move into the $1,300 area or higher.
Be that as it may, there is another newsletter writer who I respect above all others, Richard Russell of www.dowtheoryletters.com . Mr. Russell is the ultimate living authority on the DOW Theory, and he has been using it to correctly call the tops and bottoms of the major bull markets for more than half a century. With the breakdown of the DOW Jones Industrials, there has just been a bearish confirmation of the Dow Jones Transportation Average... and according to Dow theory, that's bad news for the stock market.
One thing that I'm sure of, it's going to be an exciting week. It's my opinion that if the stock markets and the U.S. dollar both rally, then we will get the pullback in gold that Matt and Robert are predicting. If the Dow rallies and the dollar falls I expect gold will rise. If the dollar rallies and the stock markets fall I think gold will rise. And if the stock market and the dollar both fall, then stand back, cause gold is a goin' ballistic.
One last thing, anyone predicting a gold price of less than 5 digits, clearly does not understand the fundamentals of gold or the current economic situation. Over the long haul, I think $10,000 is the minimum target, but it is far more likely that the dollar price of gold will become infinite. That is what happens in a hyperinflation.
By Brent Harmes
Subscribe or Manage Your Newsletter Subscription Here | Buy Gold and Silver Online
Copyright © 2009 Brent Harmes
GoldSilver.com offers vault storage accounts at Brinks Security in Salt Lake City, Utah. The minimum investment required for vault storage account is 20 ounces of gold or 1,000 ounces of silver. For more information call us at: 702-799-9000
Disclaimer : All claims made by GoldSilver.com should be verified by the reader. Investing is not suitable for everyone and readers are urged to consult with their own independent financial advisors before making a decision. Past performance is not necessarily indicative of future results. GoldSilver.com will not be liable for any loss or damage caused by a reader's reliance on information obtained in any of our newsletters, special reports, email correspondence, or on our website. Our readers are solely responsible for their own investment decisions.
Brent Harmes Archive |
© 2005-2022 http://www.MarketOracle.co.uk - The Market Oracle is a FREE Daily Financial Markets Analysis & Forecasting online publication.


