Crashing Corporate Earnings Resulting in Soaring S&P PE Ratio
Stock-Markets / Stock Market Valuations Feb 22, 2009 - 01:46 PM GMT

 Bespoke: Up days - the scarcest commodity of all
“While the world suddenly finds itself with a glut of oil and other related commodites, one thing that is certainly in short supply so far this year is an up day in the market. So far this year, the Dow has finished the day higher on 36.7% of the 32 trading days (through Wednesday). We all know that it has been a bad year, but this is down right depressing!
“In the table below, we highlight the 15 prior years where the Dow started off the year with 40% or less of the first 32 trading days finishing higher. You have to go all the way back to 1984 to find a year that started off with an even greater frequency of down days. As shown below, the rest of the year is hardly anything to get excited about. While the last three occurrences have been positive, the overall average return for the rest of the year is a decline of 2.1%.”
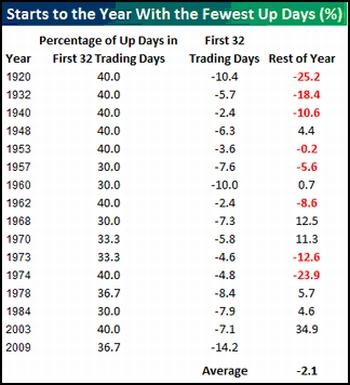
Source: Bespoke , February 19, 2009.
Bespoke: Fourth quarter earnings season - one we'd all like to forget
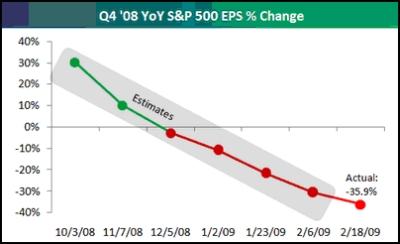
“The unofficial fourth quarter earnings season came to an end yesterday, and the numbers show that it's one we'd all like to forget. From Bloomberg, diluted year-over-year earnings for the S&P 500 are down 36% with 80% of the reports in. As shown in the chart below, analysts were expecting an increase of 30% from Q4 ‘07 to Q4 ‘08 back in October.
“And on a sector basis, three sectors saw earnings decline more than the index as a whole, while seven came in better than the index. In the chart below we have excluded Financials because its declines were off the charts (-272%). Materials saw the second biggest decline in earnings at -78%, followed by Consumer Discretionary, Energy, and Technology. Three sectors did see year-over-year increases in earnings, however. Utilities were up 6.1%, Consumer Staples were up 9.6%, and Health Care was up 9.9%.”
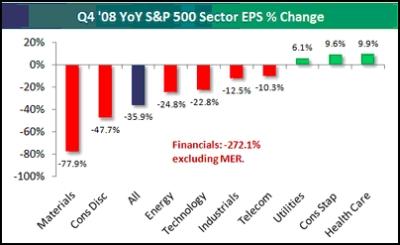
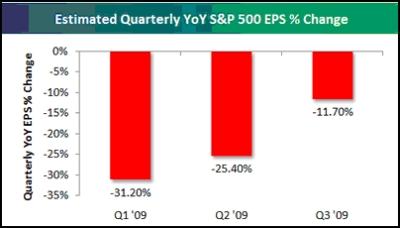
Source: Bespoke , February 18, 2009.
Carl Swenlin (Decision Point): Earnings are crashing
“The real P/E for the S&P 500 is based on ‘as reported' or GAAP earnings (calculated using Generally Accepted Accounting Principals), and it is the standard for historical earnings comparisons. The normal range for the GAAP P/E ratio is between 10 (undervalued) to 20 (overvalued). Market cheerleaders invariably use ‘pro forma' or ‘operating earnings', which exclude some expenses and are deceptively optimistic. They are useless and should be ignored.
“The following are the most recently reported and projected twelve-month trailing (TMT) earnings and price/earnings ratios (P/Es) according to Standard and Poors. I have highlighted GAAP earnings. Note that projected earnings for 2009 Q2 are $15.90. Keep in mind that the last earnings peak of $84.92 was for 2007 Q3. That's a drop of over 80%!

“Based upon projected GAAP earnings the following would be the approximate S&P 500 values at the cardinal points of the normal historical value range. They are calculated simply by multiplying the GAAP EPS by 10, 15, and 20. I have highlighted the overvalued values. Note that the S&P would have to drop to 554 just to be overvalued based on 2008 Q4 earnings projections. The outlook by 2009 Q2 is much worse.

“Of course, the market doesn't always follow these projections, but they are reasonable targets based upon the best fundamental estimates we have available.”
Source: Carl Swenlin, Decision Point , February 13, 2009.
David Fuller (Fullermoney): Invest in creditor nations
“The US has elected an interesting, intelligent and charismatic new president. This will help the country in terms of international relations. However, debt-laden economies and the USA in particular, given its size, remain at the epicentre of global economic risk. In a best-case scenario, the economic outlook might show some evidence of improvement during the secondhalf of 2009. I hope so but even in this event, global investment remains an international beauty contest.
“The investment question for all of us, I suggest, is would we rather back the debtor or creditor nations. Some may see this as a rhetorical question. Run it through a price chart filter showing relative strength since the climactic selling in October, and the choice becomes even easier for me. Not all creditor nations are doing well, but Fullermoney themes such as Brazil and especially China (note also the strength of A-Share Banks) certainly are.
“I do not doubt that if Wall Street experiences a new down leg of consequence, that its leash effect would pull other stock markets lower as well. This is an ongoing risk. However, it might not drag today's better performers to new bear market lows. More importantly, I have already seen enough to feel confident that among larger countries, China and Brazil will be upside leaders in the next significant stock market recovery. This will occur sooner rather than later if, and this is a big IF, Obama's policies can help the S&P 500 Index to remain within its current trading range.”
Source: David Fuller, Fullermoney , February 16, 2009.
Bespoke: Default risk ticks higher, but still below prior highs
“Below is a price chart of a North American investment grade credit default swap index that measures default risk for 125 companies. As shown, default risk peaked in early December 2008 and has declined somewhat since then, but it just broke above a short-term trading range today. This isn't surprising given the recent troubles in equity markets, and from a technical perspective, this breakout doesn't bode well for the market going forward.”
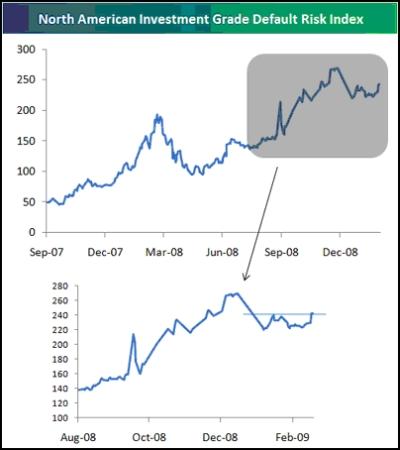
Source: Bespoke , February 18, 2009.
CEP News: Fed's Bullard says buying Treasuries still not off the table
“Federal Reserve Bank of St. Louis President James Bullard said the possibility of the Federal Reserve making outright purchases of Treasuries is not off the table, but this may not take place until the spring.
“Speaking in New York, Bullard said there is effectively no large difference between buying agency debt - which the Fed is already doing - and long-term Treasuries.
“Bullard said it is fair to say the world is entering a period of exceptionally low interest rates.
“He said the global recession will carry through until at least the first half of 2009. As for the US, he expects the first half of 2009 to see employment and output continue to deteriorate.
“On inflation, Bullard said the risks of disinflation and even deflation are real, with core inflation close to zero. He advocated an unofficial inflation target rate of 2%. The most recent reports showed headline inflation at -0.7%.
“Bullard noted that the Fed's recent efforts to expand its balance sheet have done nothing to prevent deflation.
“Bullard also said the Federal Reserve needs to find a way to keep monetary base growth rates high. He said there is no way to predict the pace of growth of the monetary base.”
Source: CEP News , February 17, 2009.
Asha Bangalore (Northern Trust): Foreign appetite for Treasury securities remains in place, for now
“The tremendous supply of US Treasury securities in the pipeline is cited as a factor that may deter foreign appetite for US Treasury securities. In December, net private sector purchases of US Treasury securities were $11.1 billion putting quarterly net purchases at $45.5 billion. Net purchases of Treasury securities were higher in the second ($86.7 billion) and third ($67.7 billion) quarters of 2008. Net official purchases of Treasury securities increased $3.9 billion in December, after two monthly declines. In the fourth quarter, official purchases of Treasury securities declined.
“In 2008, private sector net purchases of Treasury securities stood at $239.4 billion versus $195 billion during 2007, while official purchases were $76.6 billion in 2008 versus $3.0 billion in 2007.”
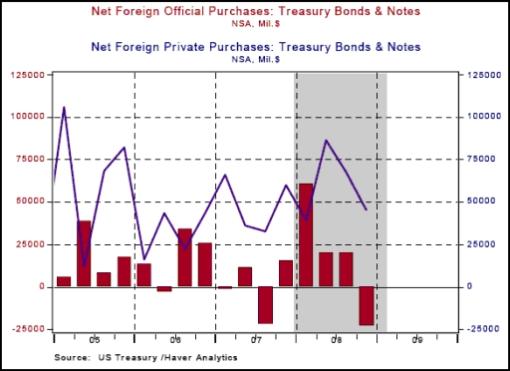
Source: Asha Bangalore, Northern Trust - Daily Global Commentary , February 17, 2009.
CNN Money: Who will buy all those Treasuries?
“Chinese doubts about the value of US Treasury bonds highlight a crucial question: Who will buy the estimated $2.7-4.2 trillion of debt expected to be issued over the next two years?
“With annual foreign purchases accounting for less than a tenth of the low end of that range, and domestic investors unable to bridge the gap, the Chinese are right to worry.
“Yu Yongding, former adviser to the People's Bank of China, recently demanded guarantees for the value of China's $682 billion of Treasury securities. Then Luo Ping, director of the China Banking Regulatory Commission, said that China had misgivings about the US economy, but despite this it would continue to buy Treasuries.
“The two statements appear designed to raise the issue non-confrontationally before new chief US diplomat Hillary Clinton's visit to Beijing on February 20.
“China worries about the dollar's value against other currencies, particularly the yuan. With US interest rates so low, the dollar's value may slide. However, President Barack Obama has repeatedly said he wants a strong dollar, and indeed its trade-weighted value rose 13.9% between April and December 2008.
“The other area of concern for China is the value of its Treasuries. Given the US borrowing requirement and its lax monetary policy, T-bond yields could well rise sharply, causing a corresponding price decline.”
Source: Martin Hutchinson, CNN , February 13, 2009.
Bespoke: The curious case of the US dollar
“As equity markets test their November lows, the US Dollar index is testing its November highs. The US Dollar has been a peculiar ‘risk-flight' trade throughout the credit crisis, as global investors have flocked to the currency with the belief that other sovereign nations are even worse off than the US. This comes at a time when gold is also rallying to new highs, and the US money supply is increasing at an astounding rate.”
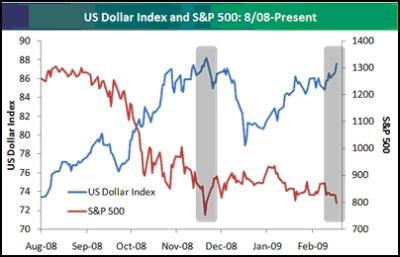
Source: Bespoke , February 17, 2009.
Michael Metcalfe (State Street Global Markets): The yen is heading for a fall
“The yen is overvalued and its status as a ‘safe haven' currency is likely to come under scrutiny, says Michael Metcalfe, head of global macro strategy at State Street Global Markets.
“He argues that analysts typically fall back on either current account positions or, better still, net foreign asset positions as a guide to which currencies should perform in times of heightened risk aversion.
“‘The rationale is that investors respond to reduced risk appetite by cutting their exposure to international investments,' Mr Metcalfe says.
“This theory appears to be supported by the fact that Japan has one of the largest surpluses on its net foreign asset position - and therefore the biggest potential for repatriation flows - and the yen has appreciated strongly.
“But Mr Metcalfe points out the Japanese are not repatriating. ‘Indeed, quite the reverse. Money is flowing out of Japan into foreign bonds and, more unusually, foreign equity markets too. This implies it has been the perception of - or potential for - repatriation that has drawn investors into bets that the yen will rise.'
“He says both speculative and institutional investors now hold significant long positions in the yen.
“‘The question is whether investors will hang on to these bets, as the reality is that the yen is overbought and overvalued and Japan's economy is sinking fast. It has the potential to be a safe haven, but the reality may prove different if Japanese investors keep buying foreign assets.'”
Source: Michael Metcalfe, State Street Global Markets (via Financial Times ), February 17, 2009.
Business Intelligence: Jim Rogers advises Gulf states to get rid of dollar peg
“The Gulf countries' currency peg to the dollar is a ‘terrible mistake' and will cause problems for the region as the US currency is expected to decline, Jim Rogers said.
“The six Gulf Cooperation Council states should form a joint currency as soon as possible, the chairman of Singapore-based Rogers Holdings said at a conference in Dubai Monday.
“The new currency shouldn't be linked to any other as the region has enough foreign reserves and oil to back it up.
“‘You've got good foreign exchange reserves and a lot of oil' to back a common currency, Rogers said during a banking conference in Dubai.
“Saudi Arabia, Kuwait, Bahrain, Qatar, the United Arab Emirates and Oman agreed in 2001 to form a European Union-style monetary union by 2010 to boost regional trade. Oman later pulled out.
“Kuwait is the only Gulf Arab state to have dropped its currency peg to the dollar, giving it some control over monetary policy.
“Gulf Arab leaders in December approved an agreement to create a central bank and single currency for the region to boost trade and strengthen monetary policy.
“A single currency would allow the Gulf states to stop pegging their currencies to the dollar and implement independent monetary policy.
“Rogers said the dollar will suffer because the US government's bailout plans and the economic stimulus will increase the US debt, weakening the US currency.”
Source: Business Intelligence , February 17, 2009.
Bloomberg: StockCharts' John Murphy - gold to outshine
Source: Bloomberg (via YouTube ), February 14, 2009.
David Fuller (Fullermoney): Gold bullion in solid uptrend
“The USD's firmness had masked some of gold's strength, until recently. However many other charts of bullion have been showing significant breakouts and resumptions of the long-term bull market for some time. You can see this in terms of bullion's performance against most currencies, including: EUR, CHF, GBP, RUB, AUD, SGD and ZAR.
“How high will gold move on this particular run?
“I have no idea, particularly in this environment, and neither does anyone else. Targets are always pure guesswork, not least because the outcome depends on so many variables.
“However, we know what gold has done on its earlier advances during this decade. Once it began to appreciate against all currencies, it subsequently also moved to new all-time highs against all of them. These moves occurred in medium-term trends persisting for at least six months from the last reaction low in the prior trading range. If that consistency was repeated in the current cycle, gold should rally well into March. The best clue of a pending peak, which you can see on the charts and which veteran subscribers will certainly remember, has been clear evidence of trend acceleration.”
Source: David Fuller, Fullermoney , February 17, 2009.
Richard Russell (Dow Theory Letters): Potential buyers of gold?
“Here are some figures, the first number is the nation's holding of gold and the second figure is the percentage that gold is of their reserves. Nations with low percentages of gold in their reserves may be expected to be potential buyers of gold.
US — owns 8,135 metric tons of gold … Gold makes up 64.4% of US reserves. The US will not sell any of its gold.
Germany — 3,412 … 64.4% of reserves
IMF — 3,217 …
France — 2,508 … 58.7%
Italy — 2,451 … 61.9%
Switzerland — 1,040 … 23.8%
Japan — 765.2 … 1.9% (a potential gold-buyer)
China — 600.0 … 0.9% (should be a big buyer)
Russia — 495. 9 … 2.2% (is a buyer)
Taiwan — 422.2 … 3.6% (should be a buyer)
India — 357.7% … 3.0% (should be a buyer)
UK — 310.3 … 14.5% (sold most of its gold at the low price)
Saudi Arabia — 143.0 … 11.4% (should buy gold)
South Africa — 124.4 … only 9.0%
Australia — 79.8 … 6.3%”
Source: Richard Russell, Dow Theory Letters , February 18, 2009.
Financial Times: Fund amasses bullion holding
“Gold holdings at the world's largest bullion-backed exchange-traded fund jumped above 1,000 metric tons for the first time, the latest indication of investor demand for bullion amid increasing financial turbulence and economic slump.
“The SPDR Gold Trust holdings have risen 228.6 metric tons so far this year, to a record 1,008.8 metric tons late on Tuesday, absorbing in the first seven weeks of the year about 10% of the world's annual mine gold output.
“The industry-backed World Gold Council said that gold consumption last year rose 4% to 3,658.6 metric tons as a 64% surge in investment demand was counterbalanced by a 11% drop in jewellery demand and a 7% fall in industrial consumption.
“Supply fell 1% last year compared with 2007 … a 42% drop in official sales from central banks and a 3% drop in mine output. Gold scrap supply jumped 17%.
“The WGC said that the extreme uncertainty that currently surrounds the global economy was unlikely to abate and should continue to underpin net investment demand, particularly for bars and coins. ‘However, we expect this to be partly offset by ongoing weakness in both industrial and jewellery demand,' it added.”
Source: Javier Blas, Financial Times , February 18, 2009.
James Turk (GoldMoney): ETFs no alternative to owning physical gold
“There is one chart I would like to share with you. Bill Murphy presented it on Friday in his commentary . It's another one of the informative charts prepared by Nick Laird of www.sharelynx.com . This chart plots both the gold price and the weight of gold recorded in GLD, the gold exchange traded fund (ETF).
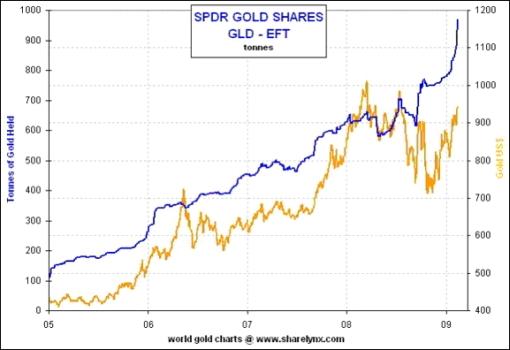
“When I look at the above chart, one key question arises immediately. How can a 150-tonne increase in demand for metal in recent weeks translate into such a relatively small increase in the price of gold? This disparity raises more questions as to whether the ETF really owns the metal supposed to be backing the shares it issues.
“I'm no fan of the precious metal ETFs, and haven't been since they were first launched.
“In short, the ETF is at best a trading vehicle, and not an alternative to owning physical gold. In this sense, the ETF is like a futures contract, which of course is not an alternative to owning physical gold either. With these trading vehicles you have exposure to movements in the price of gold, but they also come with counterparty risk, which should of course be avoided because of the ongoing economic and financial problems around the globe. The lessons in this regard were learned in September when Lehman collapsed and AIG was on the ropes, which caused numerous commodity ETFs in London to suspend trading.
“So if you want to trade the price of gold, trade futures or ETFs. But do not view futures or the ETFs as an alternative to owning physical gold and silver.
“If you are still not convinced, or even if you are, I recommend reading an article by Jim Sinclair which questions the integrity of GLD and the other gold ETFs. His February 12th report is entitled ‘ Where Do All The Gold ETFs Get Their Bullion From? ‘.”
Source: James Turk, GoldMoney , February 15, 2009.
Financial Times: Are platinum, palladium and silver prices sustainable?
“Investors searching for a safe haven have pushed gold prices to $950 a troy ounce. In their rush to safety, they have also boosted the price of silver, platinum and palladium.
“In fact, the well-reported 7.5% rise in gold prices this year pales against the 20.5% gain in silver, 14.5% rise in platinum and 15.6% increase in palladium.
“Are the gains in these three precious metals sustainable? Part of the surge is a correction from last year's crash, which saw platinum plunging from more than $2,000 an ounce to less than $800 in three months.
“Gold spikes traditionally boost other precious metals and this time is no exception, with a surge in exchange-traded funds' holdings of silver, platinum and palladium. But investors should note that, even if usually grouped under the precious metals umbrella, these three resemble industrial metals more closely, albeit expensive ones.
“Platinum and palladium are used for catalytic converters in the automotive industry, accounting for 60% of their consumption. And for silver, electronics is a large consumer.
“For these three metals, demand for jewellery is less important than for gold. The supply side, which last year boosted prices - particularly for platinum - now looks less supportive, too. As HSBC says: ‘After many years of deficit, we anticipate that the platinum market will swing into a surplus … in 2009.' Silver and palladium face a similarly loose market.
“Against that backdrop, investors will need to corner the market and sharply increase their holdings if silver, platinum and palladium prices are to sustain their upward trajectory. Further price gains are possible as long as the metals benefit from safe-haven buying. But without the support of industrial demand, any upside is probably limited.”
Source: Javier Blas, Financial Times , February 16, 2009.
Bloomberg: Shipping Index surge signals commodity currency gains
“Shipping costs have more than doubled this year, so it may be time to buy kroner, Aussies and loonies.
“The 147% jump in ocean-transport prices is evidence that China's $580 billion stimulus plan will lift raw materials, said Ihab Salib, who oversees $3 billion at Federated Investments Inc. in Pittsburgh. That would benefit countries exporting them, so Salib is ‘actively trading' Norway's krone and Australian and Canadian dollars, nicknamed Aussies and loonies.
“Salib and other currency traders have started using the Baltic Dry Index's global gauge of raw-material shipping costs to help make such decisions. The index and the value of a basket of those three resource-rich countries' currencies are increasingly moving in tandem - 96% of the time in the past year, up from 84% in the past decade, data compiled by Bloomberg show.
“‘Historically, the Baltic Dry Index is a good leading indicator for commodity prices,' said Salib, who declined to detail his investments. ‘Commodities are very depressed right now, and they offer good long-term value. Once they come back, these currencies should do well.'
“The shipping gauge is a sign that China's stimulus spending on housing, highways, airports and power grids will have impact beyond its borders. By Feb. 28, it will have spent 25% of its stimulus budget, Deutsche Bank AG said, predicting the country's economy will grow at a 12% annual rate between the fourth and first quarter, after shrinking 2.3% between the third and fourth.”
Source: Ye Xie and Candice Zachariahs, Bloomberg , February 17, 2009.
Financial Times: China/Russia oil deal
“China has what Russia wants: masses of US dollars. Russia has what China wants: energy, and lots of it. Hence Tuesday's oil-for-loans agreement between Moscow and Beijing. Russia's state-owned oil companies get 20-year loans to help them refinance while preserving capital spending; China gets cheap fuel for the duration.
“Bilateral deals happen all the time between countries. The difference here is that no one has tried to dress this up as a political or diplomatic event. This is an artifice-free exchange of one commodity for another.
“For their part, Russia's national champions avert a nasty cash crunch. The world's second-largest oil producer has been floundering amid depressed crude prices and declining production: aggregate volumes shrank by almost 1 per cent last year.
“China does very nicely too. 300,000 barrels a day amounts to about 4% of its total demand, or 8% of its total oil imports. Russia is paying 6% on the loans, implying that China is securing supplies at about $20 a barrel, according to UOB-Kay Hian, a Shanghai brokerage. As China buys most of its oil in the spot market, this is a significant saving.
“There are fringe benefits. Russia diversifies its customer base away from Europe, while China reduces its dependence on the Middle East. It also increases its chances of getting a stake in the long-term development of Russia's fabled Siberian oil reserves - perhaps at the expense of Japan. But at bottom, this is barter. How very post-crunch.”
Source: Financial Times , February 18, 2009.
Financial Times: Brazil to supply oil to China for loans
“Brazil and China signed a landmark agreement on Thursday that will ensure long-term supplies of oil to China while delivering much-needed financing to help Brazil develop enormous reserves of oil and gas recently discovered in its coastal waters.”
Source: Jonathan Wheatley, Financial Times , February 19, 2009.
Financial Times: Japan growth plunges to a 35-year low
“Japan's government faced pressure for another stimulus package on Monday after plunging exports pushed the country, the world's second largest economy, into its worst slump in 35 years.
“Economists see little prospect for a quick rebound after a quarter-on-quarter fall of 3.3% in gross domestic product in the last three months of 2008.
“The decline was worse than economists had forecast and equivalent to an annualised fall of 12.7% - the steepest drop since 1974 when import-dependent Japan suffered because of soaring oil prices.
“This time, collapsing demand for exports and weak domestic consumption are to blame.
“‘This is the biggest economic crisis since the war,' said Kaoru Yosano, minister for economic and fiscal policy.
“Government leaders have resisted announcing new action as a stimulus package drawn up last year, which includes a Y2,000 billion ($22 billion) cash handout, and the main budget for the year from April, move slowly through a parliament in which the opposition controls the upper house.
“The decline in GDP is fuelling calls for more aggressive measures from the government and the Bank of Japan.”
Source: Mure Dickie, Financial Times , February 16, 2009.
Financial Times: G7 softens tone on China
“The US and other Group of Seven industrialised countries have stepped back from criticism of China in a push for greater cooperation with Beijing and a more unified response to the global financial crisis.
“In a communique issued following their meeting in Rome at the weekend, G7 finance ministers adopted milder language than recently regarding China's handling of its currency. Tim Geithner, US Treasury secretary, also used a more conciliatory tone towards Beijing than he did last month, when he accused China of manipulating its currency to benefit exporters.
“Hillary Clinton, US secretary of state, will this week become the first senior member of the new administration to visit China as analysts look for clues as to how Washington will handle one of its most important economic relationships.
“In a speech before she left, she labelled a ‘positive, co-operative relationship' between Beijing and Washington as ‘vital to peace and prosperity, not only in the Asia-Pacific region but worldwide' and also announced the resumption of military contacts between the two nations.
“However, in a sign of potential for tension, China on Sunday hit out at a ‘Buy American' provision in the $787 billion economic stimulus package approved by the US Congress last week. ‘History and economic theory show that in facing a financial crisis, trade protectionism is not a way out, but rather could become just the poison that worsens global economic hardships,' the official Xinhua news agency said in a commentary.
“‘The G7 has realised that China needs to be brought into the fold of the global financial system rather than be treated as a pariah just because of currency inflexibility,' UBS said in a note on Sunday on the meeting. ‘This is also a realisation that as the world's largest foreign exchange reserve holder and the US's largest creditor nation, China not only holds the purse strings but its continued growth is crucial to helping the world recover from the economic crisis.'”
Source: Guy Dinmore, Daniel Dombey and Kathrin Hille, Financial Times , February 15, 2009.
Jing Ulrich (JPMorgan): China urges spending
“While the first phase of China's stimulus plans involved massive infrastructure projects and tax relief measures for manufacturers, the country's leaders have now begun speaking with greater urgency on the need to encourage consumption, says Jing Ulrich, chairman, China equities at JPMorgan.
“Recently, Premier Wen Jiabao said bluntly that the trick to spurring consumer spending was not to engage in slogans, but to put money in people's pockets.
“‘This principle has been applied literally in the issuance of consumption coupons by some local governments to low-income residents,' Ms Ulrich says. ‘This practice is likely to become more common as an alternative to income tax cuts - which might only encourage greater savings.'
“She adds that the government is also turning to rural residents to help stimulate growth.
“‘Having launched a rural subsidy programme for household appliances and electronics, authorities are planning to introduce a similar scheme for lightweight vehicles.'
“But she acknowledges that while consumer stimulus plans will help support growth, China will remain heavily dependent on trade and fixed investments until headway is made in addressing a lack of confidence in the country's social safety net.
“‘Towards this end, the State Council recently approved plans to spend $123 billion by 2011 to implement a basic universal healthcare system.'”
Source: Jing Ulrich, JP Morgan (via Financial Times ), February 19, 2009.
BCA Research: Chinese exports - not as weak as they appeared
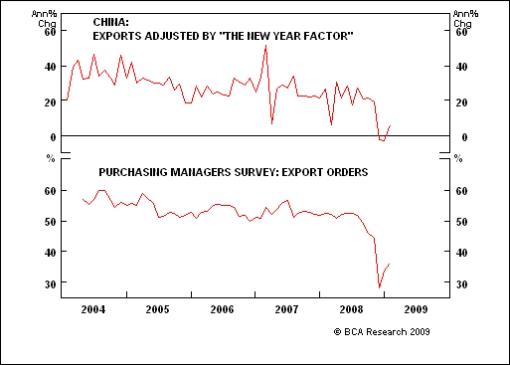
“The Chinese New Year effect is mainly to blame for China's extremely weak trade numbers in January.
“Yesterday's data release showed that Chinese exports tumbled by 17% in January and imports collapsed by 43% from a year ago. However, it is important to note that China's macro data in the first two months of the year tend to be distorted by the Chinese New Year holidays. There is no question that January's shocking trade data suggests that the economic environment remains highly challenging. Nonetheless, they are greatly exaggerated by fewer working days last month than January 2008.
“Adjusting for this factor, it is estimated that exports actually increased by 6% from a year ago, while imports dropped by 26%. The latter is also impacted by the tumble in commodity prices. The export sector performance is consistent with the most recent purchasing managers' surveys, which show a slight improvement in both export orders and industrial production.”
Source: BCA Research , February 17, 2009.
Peter Attard Montalto (Nomura): The threat from emerging Europe
“One of the biggest threats to financial stability in the eurozone comes from the region's exposure to central and eastern European banks, says Peter Attard Montalto, emerging Europe economist at Nomura.
“During the boom years, he says, high interest rates in emerging Europe led to a huge increase in foreign currency borrowing by households and companies - most notably in euros and Swiss francs. ‘Borrowers took the view that the foreign currency risk was low and offset anyway by the credit cost saving.'
“But not only did eurozone banks lend to these countries, they also took very large stakes in local institutions. ‘Indeed, more than 80% of emerging Europe bank assets are owned by western European banks,' Mr Attard Montalto says.
‘”This was fine during times of easy credit when the region's economies were growing strongly. However, widening spreads and a painful slowdown in growth now point to a serious risk to these exposures as non-performing loans may reach above 25%.
“‘This will have grave consequences for the central eastern European and Baltic economies as well as for the European banks that hold the ultimate risk.
“‘Market sentiment is currently very fragile but there is no clear agreement from the EU or other bodies about how to tackle this problem. Swift action is needed as CEE currencies continue to weaken. This issue is not going to go away on its own.'”
Source: Peter Attard Montalto, Nomura (via Financial Times ), February 16, 2009.
Financial Times: No escape from the eastern pain
“Can western banks extricate themselves from the pain of an eastern European collapse?
“These eastern neighbours owe western banks - mainly in Austria, Italy, France, Belgium, Germany and Sweden - about $1,635 billion.
“Such a figure is almost equivalent to the entire balance sheet of a major bank in any one of these countries, so the question is not trivial.
“However, a better question might be: should western banks extricate themselves from eastern Europe?
“For this group of countries, where exposures are largest, is like the canary in the coalmine of European trade. But as Poland, the Czech Republic, Hungary, Romania and Croatia sicken, western Europe cannot hope to survive with a dash back to the clean air.
“Eastern Europe is at the sharp end of the new financial protectionism, a natural consequence of government involvement in banking.
“But it is also a big contributor to western Europe's economies, accounting for almost one-quarter of German exports for instance.
“There has been a certain amount of vendor finance at work here. High local interest rates as governments tried to cool growth and move in line with the eurozone encouraged consumers to import first western debt in euros and Swiss francs, then more western goods. Sadly, they have also imported the credit crunch through the same channels.
“The quandary is not going unrecognised - Hungary has already had European Union support. But neither is it fully appreciated. Some believe the euro is doomed to trail after its poorer neighbours. The more the Polish zloty or Hungarian florint sicken, the worse the euro will feel. There is a credit trade choice to be made, too: should you buy protection on, say, Austria or Germany? As the canary chokes, the answer looks like the latter.”
Source: Paul Davies, Financial Times , February 17, 2009.
Did you enjoy this post? If so, click here to subscribe to updates to Investment Postcards from Cape Town by e-mail.
By Dr Prieur du Plessis
Dr Prieur du Plessis is an investment professional with 25 years' experience in investment research and portfolio management.
More than 1200 of his articles on investment-related topics have been published in various regular newspaper, journal and Internet columns (including his blog, Investment Postcards from Cape Town : www.investmentpostcards.com ). He has also published a book, Financial Basics: Investment.
Prieur is chairman and principal shareholder of South African-based Plexus Asset Management , which he founded in 1995. The group conducts investment management, investment consulting, private equity and real estate activities in South Africa and other African countries.
Plexus is the South African partner of John Mauldin , Dallas-based author of the popular Thoughts from the Frontline newsletter, and also has an exclusive licensing agreement with California-based Research Affiliates for managing and distributing its enhanced Fundamental Index™ methodology in the Pan-African area.
Prieur is 53 years old and live with his wife, television producer and presenter Isabel Verwey, and two children in Cape Town , South Africa . His leisure activities include long-distance running, traveling, reading and motor-cycling.
Copyright © 2009 by Prieur du Plessis - All rights reserved.
Disclaimer: The above is a matter of opinion and is not intended as investment advice. Information and analysis above are derived from sources and utilizing methods believed reliable, but we cannot accept responsibility for any trading losses you may incur as a result of this analysis. Do your own due diligence.
Prieur du Plessis Archive |
© 2005-2022 http://www.MarketOracle.co.uk - The Market Oracle is a FREE Daily Financial Markets Analysis & Forecasting online publication.


