


Liquidity Outflows Keeping the Stock Market Down
Stock-Markets / Stock Index Trading Feb 21, 2009 - 09:50 PM GMTBy: Marty_Chenard

 Let's talk about Liquidity versus the Stock Market today ...
When Liquidity is expanding, then there is more money available to chase fewer goods and that causes prices to go up. That happens for products, commodities, and the stock market.
When Liquidity is contracting, then there is less money available to buy from the higher inventory of products ... and that causes prices to go down because some sellers "lower their prices" to entice one of the few buyers remaining with cash.
As you will see today, the same thing happens in the stock market. Money flowing in, with Liquidity levels expanding, causes the stock market to go UP. Money flowing out, with Liquidity levels contracting, causes the stock market to go DOWN.
To understand what has happened to the stock market, lets look at what happened to Liquidity since last year.
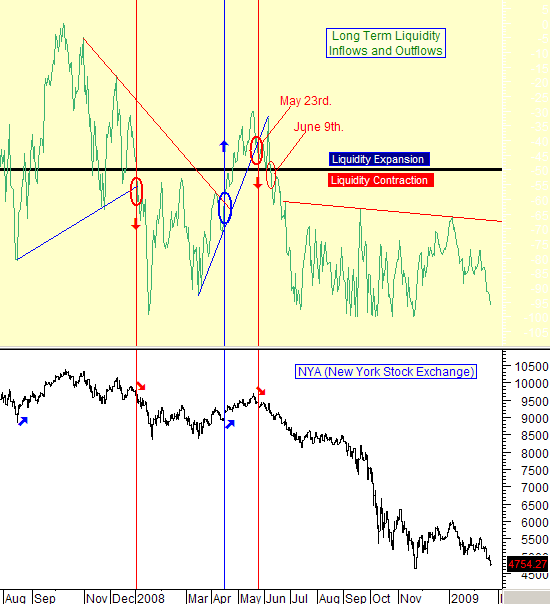
In early April of 2008, Liquidity had been in Contraction. Mid way through April, the Liquidity's resistance line was broken to the upside creating a change toward liquidity expansion. That expansion continued, with Liquidity reaching " Expansion Territory " and then breaking its support line on May 23rd.
May 23rd. ... that was the beginning of a down trend in Liquidity. Then, Liquidity kept leaving the stock market ... and just a few weeks later on June 9th., Liquidity went into "Contraction Territory" .
Now follow what happened to the stock market, as each of those events occurred in the chart below.
Pretty simple relationship, isn't it?
What's important, is where Liquidity is now, and what direction it is going in. (The chart below is as of 2 PM on Friday afternoon.)
What is the chart saying? First, it is saying that Liquidity has been in contraction territory since June 9th of last year ... and the stock market has fallen that entire period of time.
Second, it is saying that Liquidity is in still contraction territory, AND it is still below its resistance line.
Third, Liquidity has been outflowing in the past few days, and was still dropping this morning.
The DOW tested its November low today, and was 1.91% below that low at 2:12 PM today.
At the same time, the NADSAQ 100 was divergently positive because it was 12.03% higher than its November low.
Today is Options Expiration day, so there is some re-balancing going on. Watch what happens at the end of the day today, and Monday when the smoke clears.
If Liquidity outflows continue on Monday, then the market will be in trouble . (The Long Term Liquidity Inflow/Outflow chart is a proprietary chart that is posted every day on our paid subscriber site.)
________________________________________________
*** Feel free to share this page with others by using the "Send this Page to a Friend" link below.
By Marty Chenard
http://www.stocktiming.com/
Please Note: We do not issue Buy or Sell timing recommendations on these Free daily update pages . I hope you understand, that in fairness, our Buy/Sell recommendations and advanced market Models are only available to our paid subscribers on a password required basis. Membership information
Marty Chenard is the Author and Teacher of two Seminar Courses on "Advanced Technical Analysis Investing", Mr. Chenard has been investing for over 30 years. In 2001 when the NASDAQ dropped 24.5%, his personal investment performance for the year was a gain of 57.428%. He is an Advanced Stock Market Technical Analyst that has developed his own proprietary analytical tools. As a result, he was out of the market two weeks before the 1987 Crash in the most recent Bear Market he faxed his Members in March 2000 telling them all to SELL. He is an advanced technical analyst and not an investment advisor, nor a securities broker.
Marty Chenard Archive |
© 2005-2022 http://www.MarketOracle.co.uk - The Market Oracle is a FREE Daily Financial Markets Analysis & Forecasting online publication.