


Stock and Commodity Market Rising Wedge Formation Price Pattern
Stock-Markets / Technical Analysis Feb 21, 2009 - 09:42 PM GMTBy: Brian_Bloom

 Stranger than fiction? - You will not read the analysis below anywhere else. It flows from a unique discovery I made before the Nasdaq bubble finally collapsed
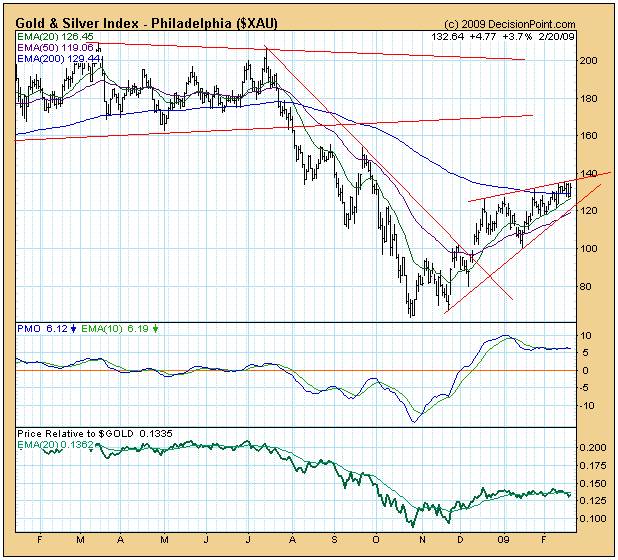
I discovered an interesting variation of a rising wedge formation – which the text books tell us is impossible, but it happened anyway and it cost me a lot of money because I was short the market when the wedge broke up and prices continued to rise.
Typically, a rising wedge is formed as a reaction within a bear market. When it breaks down, price continues down to the point where the wedge commenced; often beyond, as the bear trend continues.
But it doesn’t always happen this way. What I discovered was that when the trend is “up” and the rising wedge manifests within the rising trend, then the break might well be to the upside of the wedge. Since then I have witnessed this phenomenon only a few times – when there has been extraordinary power within the rising trend. (Charts courtesy decisionpoint.com)
One of the factors on which I have been focusing in the past few days is the gaps in the weekly bar chart of gold (see below)
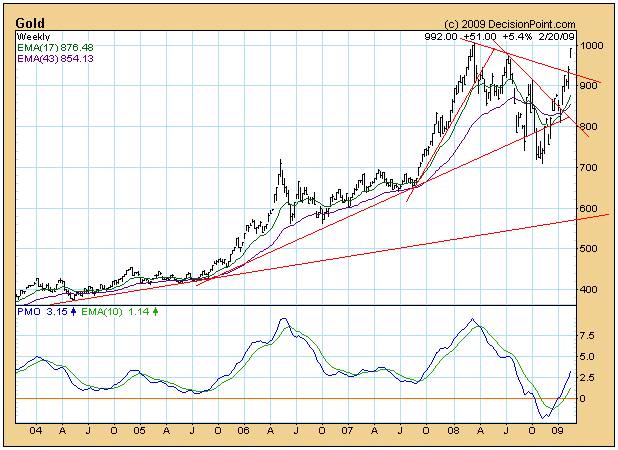
The first one occurred at around $850 (midpoint) and has not been covered, whilst the second occurred at $960 (midpoint).
If the first gap was a “breakaway” gap and the second gap was a “runaway” gap then the next move in the gold price will take it to $1,070 ($960 plus $110)
I did not comment on this in my most recent article because a breakup of such magnitude would normally indicate a panic into gold because of a fear of inflation – and the 30 year T-Bond yield does not appear to be anticipating inflation. The second reason it might break up savagely “might” be because of a brewing fear regarding a collapse in the international monetary system – which is not being anticipated by the Dollar Index chart.
It occurred to my unconscious mind in the past half-hour or so that we might be witnessing a “bifurcation” in the world’s markets – where the professional investors with access to large licks of capital (tens of billions of dollars) are behaving one way, and the private investors in search of a safe haven for their millions of dollars are behaving in another way. The Big Boys may be playing the currency and bond markets and the savvy little guy may be playing the gold market because the currency and bond markets are too rich for his blood at present. .
If this turns out to be the case, then I would expect the gold price to decouple itself from the typical leverage of the gold shares – because gold “shares” are not a safe haven. Gold miners have capitalization issues and operational issues which do not apply to gold itself. Below are charts of the ratio of the $XAU:$GOLD and $HUI:$GOLD
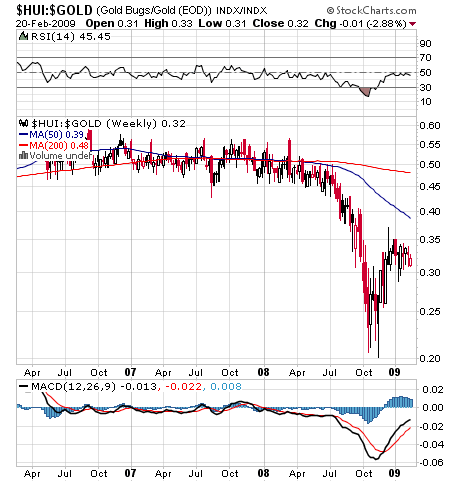
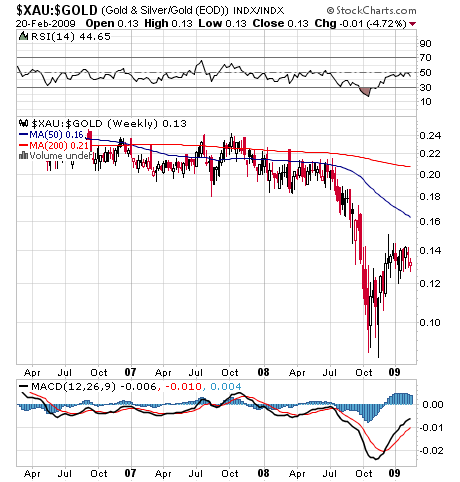
Note how the weekly charts of the two ratios are rolling over, as are the MACDs (chart courtesy stockcharts.com)
Normally, if the ratio of gold share index to the gold price rolls over it would be interpreted as a harbinger of a fall in the gold price because the shares are leveraged to the gold price.
Everything would fit perfectly if that rising wedge within a rising trend on the gold shares was a bearish formation:
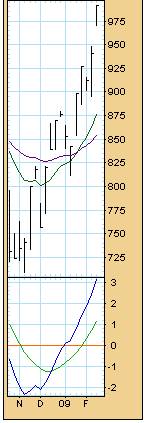
- The gold price would be on the point of pulling back because it is overbought on the daily charts as can be seen from the oscillator
- The gold share prices would be “leading” the gold price down
- The gap in the weekly chart of the gold price would probably turn out to be an “exhaustion” gap – which would need to be covered
- The original so-called breakaway gap would then also need to be covered, and the gold price would pull back all the way to $850 an ounce.
All very neat and tidy; but maybe too neat and tidy?
That’s when I started asking myself: “What if?”
What if that rising wedge on the $XAU is in fact a bullish formation, and what if the two gaps in the gold price are in fact a breakaway and runaway gap respectively?
What is likely to happen under those circumstances is that the gold shares will break up strongly, but the gold price would need to “scream” up as its rate of increase outpaced the gold shares. That would allow the ratio of the Gold share index to the gold price to remain weak. One reason I am attracted to this scenario is that more than 40 years of watching the markets has taught me that the market is a mechanism for parting the opportunistic investor from his money. If the chartists are singing mindlessly from their standard hymn books, then they will be bailing out of gold shares and gold bullion at exactly the wrong time. Hmm?
In my view, the only basis on which this strange alternate scenario could materialize (a break up in both the gold shares and the gold price at this point in time), is if the little guy is driving the movements in the gold price and the institutions are focusing elsewhere. The hard fact is that the gold market is too small for the really big players to play around in. There are trillions of dollars sloshing around in the bond markets and in the currency markets – far too many to be meaningfully diverted to gold.
But it’s the little guy who is typically enamored of gold. If the Dow Theory Sell signal leads to a Wyle E Coyote collapse in industrial equities, it might well be the little guy who panics into gold when the equity market crash comes.
Clearly, no one can make that call in advance. But I remember very clearly and painfully that rising wedge which broke up when it should have broken down. Could this be one of those cases?
By Brian Bloom
Beyond Neanderthal is a novel with a light hearted and entertaining fictional storyline; and with carefully researched, fact based themes. In Chapter 1 (written over a year ago) the current financial turmoil is anticipated. The rest of the 430 page novel focuses on the probable causes of this turmoil and what we might do to dig ourselves out of the quagmire we now find ourselves in. The core issue is “energy”, and the story leads the reader step-by-step on one possible path which might point a way forward. Gold plays a pivotal role in our future – not as a currency, but as a commodity with unique physical characteristics that can be harnessed to humanity's benefit. Until the current market collapse, there would have been many who questioned the validity of the arguments in Beyond Neanderthal. Now the evidence is too stark to ignore. This is a book that needs to be read by large numbers of people to make a difference. It can be ordered over the internet via www.beyondneanderthal.com
Copyright © 2009 Brian Bloom - All Rights Reserved
Disclaimer: The above is a matter of opinion provided for general information purposes only and is not intended as investment advice. Information and analysis above are derived from sources and utilising methods believed to be reliable, but we cannot accept responsibility for any losses you may incur as a result of this analysis. Individuals should consult with their personal financial advisors.
Brian Bloom Archive |
© 2005-2022 http://www.MarketOracle.co.uk - The Market Oracle is a FREE Daily Financial Markets Analysis & Forecasting online publication.