Near-Term Peak Approaching for ProShares UltraShort SPY (AMEX: SDS)
Stock-Markets / Stock Index Trading Feb 20, 2009 - 01:34 PM GMTBy: Mike_Paulenoff
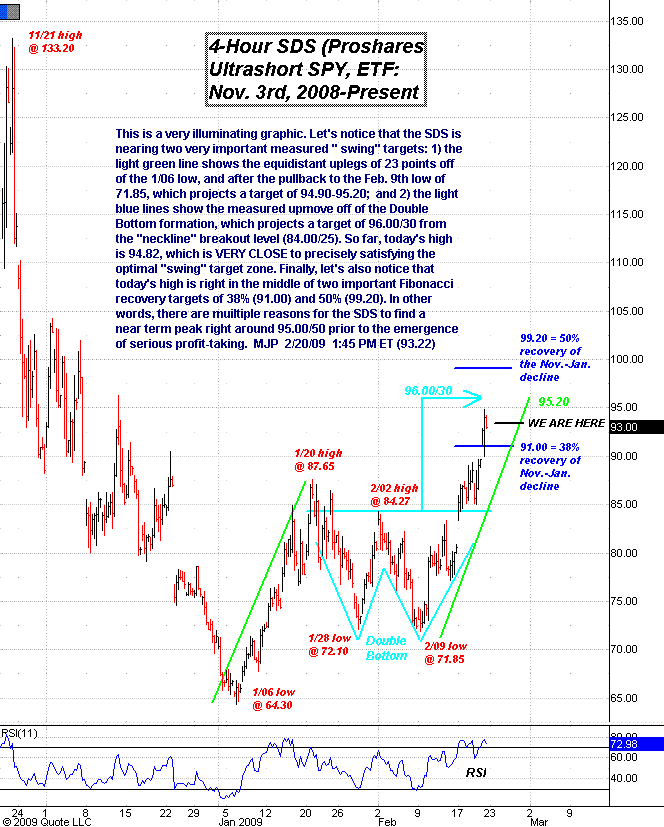
 The 4-hour chart of the ProShares UltraShort SPY (AMEX: SDS) is a very illuminating graphic. The SDS is near two very important "swing" targets: 1) the light green line shows the equidistant uplegs of 23 points off of the 1/06 low, and after the pullback to the Feb 9th of 71.85, which projects a target of 94.90-95.20; and 2) the light blue lines show the measured upmove off of the Double Bottom formation, which projects a target of 96.00/30 from the "neckline" breakout level (84.00/25). So far, today's high is 94.82, which is very close to precisely satisfying the optimal "swing" target zone.
Finally, let's also notice that today's high is right in the middle of two important Fibonacci recovery targets of 38% (91.00) and 50% (99.20). In other words, there are multiple reasons for the SDS to find a near-term peak right around 95.00/50 prior to the emergence of serious profit-taking.

Sign up for a free 15-day trial to Mike's ETF Trading Diary today.
By Mike Paulenoff
Mike Paulenoff is author of the MPTrader.com (www.mptrader.com) , a real-time diary of Mike Paulenoff's trading ideas and technical chart analysis of Exchange Traded Funds (ETFs) that track equity indices, metals, energy commodities, currencies, Treasuries, and other markets. It is for traders with a 3-30 day time horizon, who use the service for guidance on both specific trades as well as general market direction
© 2002-2009 MPTrader.com, an AdviceTrade publication. All rights reserved. Any publication, distribution, retransmission or reproduction of information or data contained on this Web site without written consent from MPTrader is prohibited. See our disclaimer.
Mike Paulenoff Archive |
© 2005-2022 http://www.MarketOracle.co.uk - The Market Oracle is a FREE Daily Financial Markets Analysis & Forecasting online publication.


