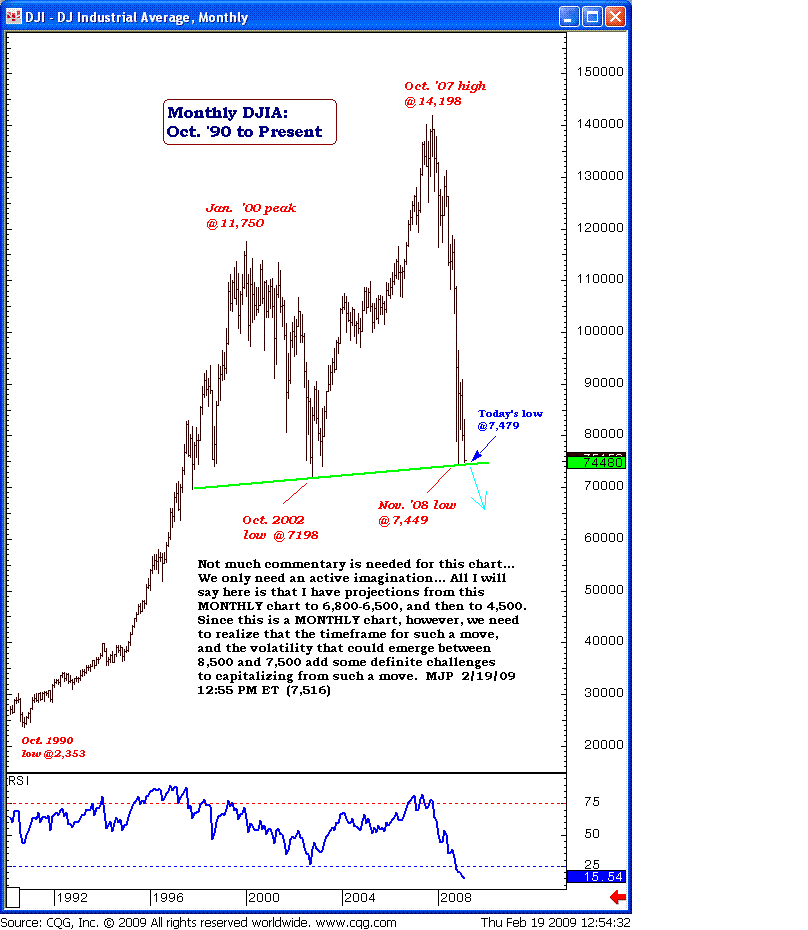
Dow Jones Monthly Stock Chart Points to 4500 Crash
Stock-Markets / Stocks Bear Market Feb 19, 2009 - 02:58 PM GMTBy: Mike_Paulenoff
 Not much commentary is needed when viewing the monthly chart of the Dow. We only need an active imagination. All I will say here is that I have projections from this monthly chart to 6800-6500 and then to 4500. Since this is a monthly chart, however, we need to realize that the timeframe for such a move, and the volatility that could emerge between 8500 and 7500, add some definite challenges to capitalizing from such a move in trading the Dow Diamonds Trust (NYSE: DIA) or the ultra long or short Dow ETF instruments.

Sign up for a free 15-day trial to Mike's ETF Trading Diary today.
By Mike Paulenoff
Mike Paulenoff is author of the MPTrader.com (www.mptrader.com) , a real-time diary of Mike Paulenoff's trading ideas and technical chart analysis of Exchange Traded Funds (ETFs) that track equity indices, metals, energy commodities, currencies, Treasuries, and other markets. It is for traders with a 3-30 day time horizon, who use the service for guidance on both specific trades as well as general market direction
© 2002-2009 MPTrader.com, an AdviceTrade publication. All rights reserved. Any publication, distribution, retransmission or reproduction of information or data contained on this Web site without written consent from MPTrader is prohibited. See our disclaimer.
Mike Paulenoff Archive |
© 2005-2022 http://www.MarketOracle.co.uk - The Market Oracle is a FREE Daily Financial Markets Analysis & Forecasting online publication.


