


Stock Market Pauses After Last Weeks Big Gains
Stock-Markets / Financial Markets 2009 Feb 09, 2009 - 04:55 PM GMT
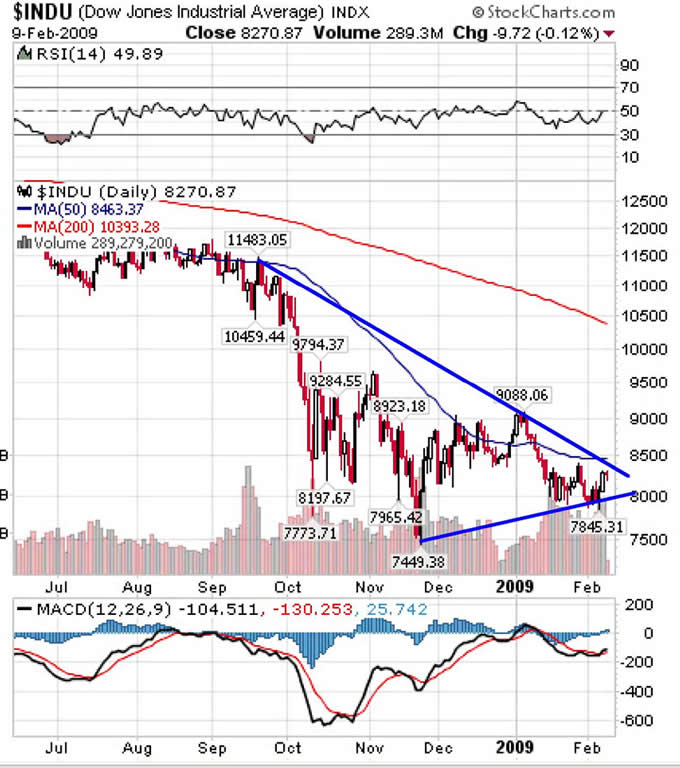
 After some big gains last week, today was a bit of a ho-hum affair as the DJIA only finished down 9.72 points. Does this rally have legs? We will know soon enough. There is a trendline (see the chart) right overhead the current price. Moreover, the DJIA's recent nemesis, the 50 dma , sits menacingly above at 8463.
After such a large gain, it is common for traders to take some profits. As for candlestick analysis the doji candle that was formed today is normally not a rally killer after a large move. However, be wary if another doji or a small-bodied candle forms. This is known as a "dumpling top," and usually gives a good indication that the bears will soon be in control.
One positive to take away from this chart is the decrease in volatility over the last several months. Notice how over time the price movement has become less and less volatile. That is one indicator that we may soon face better times.
Positions: None
By Kingsley Anderson
http://tradethebreakout.blogspot.com
Kingsley Anderson (pseudonym) is a long-time individual trader. When not analyzing stocks, he is an attorney at a large law firm. Prior to entering private practice, he served as a judge advocate in the U.S. Army for five years and continues to serve in the U.S. Army Reserves. Kingsley primarily relies on technical analysis to decipher the markets.
Kingsley's website is Trade The Breakout (http://tradethebreakout.blogspot.com)
Copyright © 2009 Kingsley Anderson - All Rights Reserved
Disclaimer: The above is a matter of opinion provided for general information purposes only and is not intended as investment advice. Information and analysis above are derived from sources and utilising methods believed to be reliable, but we cannot accept responsibility for any losses you may incur as a result of this analysis. Individuals should consult with their personal financial advisors.
Kingsley Anderson Archive |
© 2005-2022 http://www.MarketOracle.co.uk - The Market Oracle is a FREE Daily Financial Markets Analysis & Forecasting online publication.