


Gold, Silver, Oil and Broad Stock Market Outlook
Stock-Markets / Financial Markets 2009 Feb 09, 2009 - 12:16 AM GMTBy: Chris_Vermeulen

 Last week was exciting as the broad market dipped back down to test Hogan's Bottom again. The market found support and posted a nice two day rally on increased volume as buyers stepped back into the market. The two biggest sectors were financials and homebuilders posting solid gains for the week. It's important to note that both those sectors had the largest amount of short selling, it looks like traders started to cover their short positions, which boosted both those sectors. The market does look like momentum is shifting to the upside but we could still see prices drift sideways or even lower for another couple months, as investors need to become more confident and start investing again.
The Stock Market Barometer – Dow Index – DIA Fund
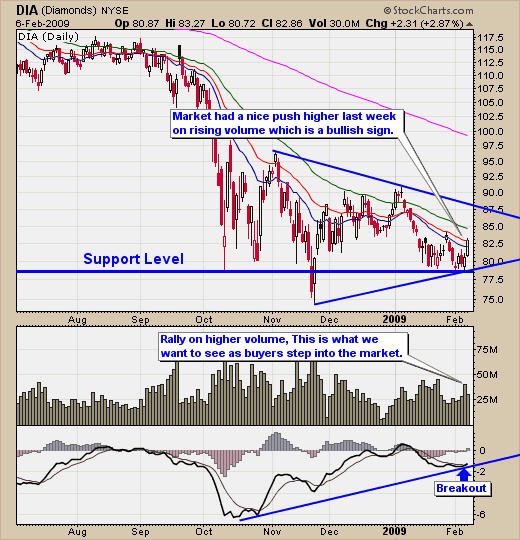
I like to look at the Dow for the overall health of the market, as it has provided excellent information for trading in the past. As you can see on the DIA daily chart, the price action seems to be forming a bottoming pattern, which I wrote about last week in my report Broad Market Is Bottoming . The daily chart clearly shows the price action is currently trending sideways and is working its way to the end of this triangle. Volume picked up on Thursday and Friday, which is nice to see. Also the MACD is showing bullish momentum and with any luck, the market will breakout to the upside.
Dow – DIA Chart
Gold & Gold Stocks
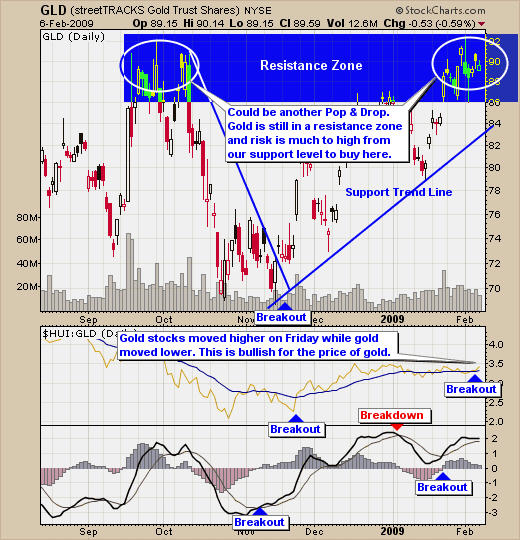
Gold bullion closed lower for the week while gold stocks held value after Thursday's and Friday's broad market rally, this tends to pull most stocks higher with it. As you can see on the daily gold bullion chart, gold is trading at resistance and looking very toppy, which means it could roll over and come back down to test our support trend line. Currently gold is over 6% above our support trend line and I am looking for a pullback and reversal, which will minimize down side risk, so that it is below 3%.
Daily Gold Chart – GLD Fund
Silver Bullion
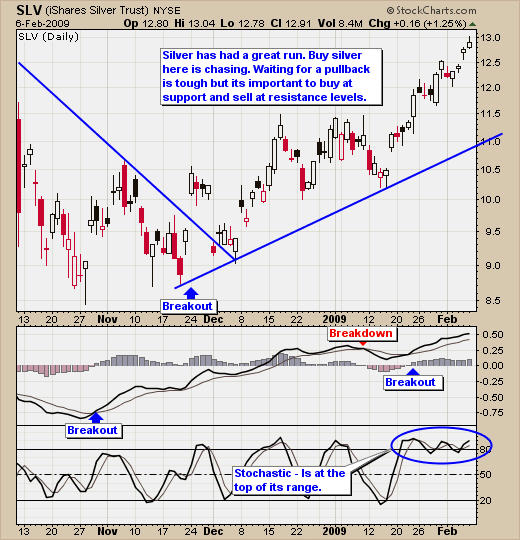
Silver bullion has had a great run since December. The daily chart shows that the price looks to be extended to the up side and a pullback could occur any day now. Let's wait for a proper setup before pulling the trigger.
Silver Bullion Trading Chart – SLV Fund
Crude Oil
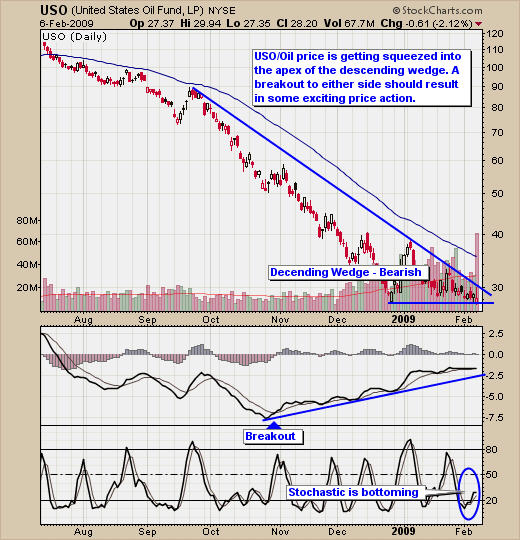
Crude oil continues to be under pressure, as every small rally is met with heavy selling pushing prices lower. The daily oil chart shows the price is stuck within a descending wedge, which is a bearish pattern and a break to the down side should be expected. A couple of bullish things about oil has everyone thinking it's about to pop higher any day, which is the fact the MACD momentum has big divergence, stochastic has bottomed and the fact that the price of oil is down 70% and more than ready for a rally. That being said there are rumors going around that oil could still continue to drop to the $25 per barrel level. I continue to wait for low risk setup before putting money to work in these commodities.
Crude Oil Trading Chart – USO
Trading Conclusion:
Both gold and silver currently have too high of a risk to jump in at these levels. I do hate to watch investments run away but I hate chasing only to have it roll over on me a few days later. Waiting for some type of pullback in price, is what I am waiting for. Crude oil seems to be stuck at this price level and it could go either way really fast from here. Until a direction is in motion, I will be sitting on the side lines waiting for a low risk entry point to go long or short.
In a study from Jeremy Siegel a professor of finance of Pennsylvania the great depression was actually an advantage to long term investors, as it gave an opportunity to reinvest in high dividend stocks and funds at prices, which they would never see again. During the past 200 years, the average stock market growth has be an average of 6.6% after inflation. 2008 posted a loss of 39.4% loss, which is the 5th biggest bear market crash in history. The biggest was in 1865 losing 43.1% loss.
Another interesting fact is that the average dividend on the US stock market is over 3%, which pays more than the interest rates on long term bonds. This happened once before 50 years ago and we will most likely not see an opportunity like this again in our lifetime.
I have put together a package for yearly subscribers which is if you join for a year ($299) I will send you $300 in gas vouchers FREE which are valid at the major gas stations in USA & Canada. Valid At: Chevron, Texaco, Sunoco, CITGO, Mobil, Esso, Shell, BP, And More... as Holiday Special!
If you interested please act fast as I only have a 21 of these gas vouchers before they are gone for good.
If you would like to receive my free weekly market updates please visit my website: www.TheGoldAndOilGuy.com
I look forward to hearing from you soon!
By Chris Vermeulen
Chris@TheGoldAndOilGuy.com
Please visit my website for more information. http://www.TheGoldAndOilGuy.com
Chris Vermeulen is Founder of the popular trading site TheGoldAndOilGuy.com. There he shares his highly successful, low-risk trading method. For 6 years Chris has been a leader in teaching others to skillfully trade in gold, oil, and silver in both bull and bear markets. Subscribers to his service depend on Chris' uniquely consistent investment opportunities that carry exceptionally low risk and high return.
This article is intended solely for information purposes. The opinions are those of the author only. Please conduct further research and consult your financial advisor before making any investment/trading decision. No responsibility can be accepted for losses that may result as a consequence of trading on the basis of this analysis.
Chris Vermeulen Archive |
© 2005-2022 http://www.MarketOracle.co.uk - The Market Oracle is a FREE Daily Financial Markets Analysis & Forecasting online publication.