A Tale of Two Crudes, WTI Divergence from Brent Crude Oil
Commodities / Crude Oil Apr 27, 2007 - 09:54 PM GMTBy: Elliot_H_Gue
 I've received considerable e-mail from The Energy Letter subscribers asking about a rather unusual phenomenon in the crude oil markets today: a massive, unusual divergence between the prices of two of the world's most-popular crude oil benchmarks, Brent and West Texas Intermediate (WTI).
As it turns out, this was a major topic covered in the most-recent issue of my subscription-based newsletter, The Energy Strategist ( www.energystrategist.com ). The explanation of this divergence also reveals signs of underlying strength in global oil demand. I've reproduced that analysis below:
Premium Event
One of the most unusual and interesting developments in the past two months has been the stark divergence in performance between two of the most common crude oil benchmarks in the world--WTI and Brent crude.
To make a long story short, Brent is a slightly lesser grade of oil than WTI. Both oils are considered light, sweet crudes, but standard Brent has an American Petroleum Institute (API) gravity of about 38.1 degrees and a sulphur content of 0.39 percent. In contrast, WTI has an API gravity of 40 degrees and a sulphur content of 0.3 percent.
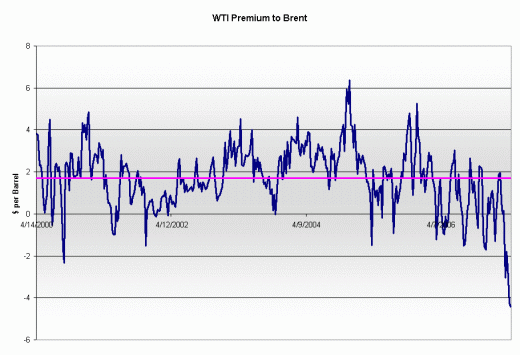
This is one reason why WTI has historically traded at a slight premium price to Brent. In fact, based on the past seven years of data, WTI has averaged a premium of $1.72 to Brent. Check out the chart below.

Source: Bloomberg
The chart above shows the premium of WTI over Brent in terms of dollars per barrel based on weekly data going back to April 2000. The solid line shows that average premium of about $1.72.
As you can see, prior to 2006 there were a few short-lived spikes when the price of Brent temporarily exceeded WTI. But the action in the past year looks notably different: Brent has moved to a premium on several occasions.
Since the beginning of 2007, that pattern has become even more notable; Brent has been trading at an ever-widening premium to WTI. That premium now exceeds $4 per barrel, a far cry from the normal discount of $1.72.
At first blush, this doesn't appear to make much sense. If Brent is a slightly inferior crude, then it should trade at a slight discount. If we factor in current US gasoline prices and current prices for Brent and WTI, it's clear that US refiners would prefer to refine WTI over Brent right now. That's because the crack spread on a barrel of WTI is roughly $6 more than for a barrel of Brent.
This is why historically whenever Brent has traded at a premium, that premium has closed quickly. When Brent trades at a significant premium to WTI, US refiners start refining more WTI (and other types of crude) and less Brent. This reduces demand for Brent and pushes up demand for WTI, putting downward pressure on Brent prices relative to WTI.
This is a fancy way of saying that the relationship between Brent and WTI tends to be stabilized over time because of simple market forces. In the past, these temporary inversions of the normal WTI/Brent premium have been caused by short-lived supply disruptions.
Recent experience, however, suggests that other factors have entered the equation. There are obviously more forces at work in the crude oil market than just the quality of the crude and current refining economics. This enigma can be explained when you consider where these crudes come from and how they're priced.
Major oil producers including Russia and Nigeria use Brent as a benchmark for pricing the crude they produce. In total, it's estimated that a little more than 20 million barrels of daily oil production are priced using Brent as a benchmark; it's a key crude blend for the European market and, to some extent, for Asia.
In contrast, WTI has historically been more of a US crude oil basket. Not only is it used as the basis for US-traded oil futures, but it's also a key benchmark for US production. Therefore, WTI more closely reflects US supply/demand fundamentals, while Brent tends to be more influenced by global events and international supply/demand fundamentals.
Of course, traditionally the US and global oil markets have been closely related; the US is, after all, still the world's single-largest consumer of crude oil, as well as the largest importer. But right now, there are some very real reasons this traditional relationship has shifted. To understand this, you need to examine the current oil and gasoline demand situation in the US as it compares to the rest of the world.
An American Story
According to the latest Oil Market Report, released by the International Energy Agency on April 12, US gasoline demand is unusually strong right now. US gasoline demand averaged 9.4 million barrels a day during the four weeks through April 6, roughly 2.5 percent above the same levels last year. This is nearly double the long-term average pace of annual gasoline demand growth.
That demand growth is impressive when you consider that retail gasoline prices have been rising steadily since January. In the West, prices are already rising above $3 per gallon, yet there's little sign of slowing gasoline demand.
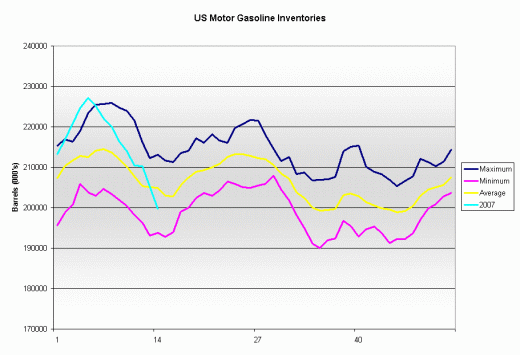
This situation is clearly visible when you consider the big shortage developing in US gasoline inventories as we enter the run-up to the peak demand summer driving season. Take a look at the chart below.

Source: Energy Information Administration , Bloomberg
This chart uses data going back five years. I've included four lines showing the maximum, minimum, 2007 year-to-date and average US gasoline inventories during this five year-period.
It's clear that 2007 gasoline inventories were at the high end of the historic range for the first few weeks of the year. In fact, for much of January, inventories were actually above the maximum levels recorded in any year going back to 2002.
But that's all changed. In the past nine weeks, inventories of gasoline have fallen precipitously; current gasoline inventories are way below average for this time of year. Even more interesting, those inventories are actually continuing to fall quickly during a season when US refiners typically build their inventories.
And I'm not adjusting these figures to account for the higher-than-normal gasoline demand in the US right now; these are raw inventory figures from the Energy Information Administration (EIA). If we adjusted for the recent, sustained, heightened demand, the inventory picture for gasoline would look even more bullish.
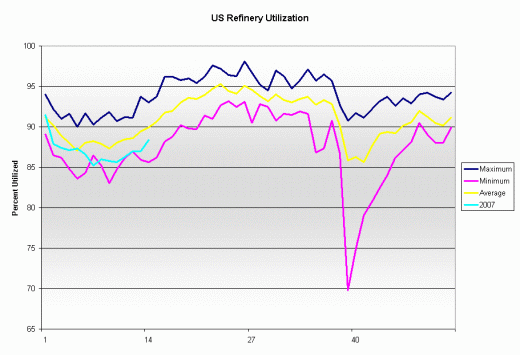
In addition to far stronger-than-normal gasoline demand, gasoline prices are also rising because of reduced output from US refineries. A series of refinery accidents, fires and outages have severely curtailed refinery output so far in 2007. The best measure of this is refinery utilization, a measure of what percentage of total US refining capacity is currently working.
Simply put, the higher the percentage, the more petrol that's flowing out of refineries. Check out this seasonal chart of refinery utilization below. Just as with the chart of gasoline inventories, this chart is based on the past five years worth of data. I've once again depicted the maximum, minimum, and average capacity utilization data in this five-year history. I've also overlaid the current year-to-date (2007) utilization numbers.

Source: EIA , Bloomberg
What's clear here is that refinery utilization has remained far below average this year because of these ongoing refinery outages. This means even though American consumers are demanding more gasoline and diesel than normal this year, US refineries aren't able to produce enough gas to meet that demand. A powerful combination of both strong demand and weak refinery utilization is behind that precipitous drop in inventories.
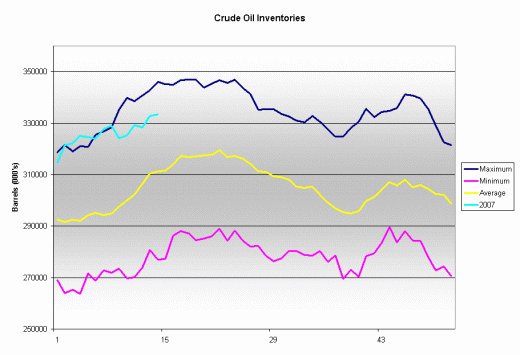
Of course, the one commodity that's not in short supply in the US right now is crude oil. Check out the chart of current US crude oil inventories.

Source: EIA , Bloomberg
This chart is identical in construction to both the gasoline inventory and capacity utilization charts. What really jumps out from this chart is that US crude oil inventories are above average for this time of year; the US has plenty of oil in storage. In fact, US inventories set new five-year highs several weeks earlier this year before flattening out more recently.
The large inventories of crude oil in the US have absolutely nothing to do with weak demand. It's the refiners that use crude oil, not consumers directly. You don't fill your car with crude oil; you fill it with gasoline. Refiners buy crude oil to make gasoline and other refined products.
The reason that oil inventories are so high right now is simply that the nation's refiners aren't working at anything close to normal capacity; therefore, they're not refining all the crude inventoried to make gasoline.
Don't make the mistake of thinking that high US crude oil inventories are a symptom of a weakening US economy, the latest subprime bust or any other macroeconomic problem. The true demand picture in the US is revealed by the gasoline market. Gasoline demand is high, and inventories are falling at the fastest pace in many years. The broken link that's causing crude oil inventories to build domestically is the refiners.
These factors bring us back to the WTI/Brent spread paradox mentioned earlier in the intro. You can clearly see why US oil demand is relatively low: Refiners already have plenty of oil and are unable to refine it fast enough to meet demand.
As I noted earlier, the price of WTI is heavily influenced by the picture for US crude oil supply and demand. The current high inventories of crude are weighing on WTI prices.
The Global Picture
Globally, the supply/demand situation for the crude oil markets is different. Total crude and refined products stocks in the Organisation for Economic Co-operation and Development (OECD) countries—the developed world--fell by about 80.5 million barrels in February.
In addition, according to preliminary data for March, inventories continued to decline in the OECD in a season when inventories typically build. The IEA estimates that total stocks in the US, Europe and Japan declined at a rate of more than 1 million barrels per day throughout the first quarter of the year--a higher-than-average decline for that time of year.
But what's even more bullish is the global supply picture for oil. According to the IEA, March oil output from OPEC totaled about 30.1 million barrels, a further 165,000 barrels per day cut from February levels. When you factor Angola--a new OPEC member in January--out of the equation, it's the lowest output from OPEC since January 2005. The IEA has reiterated the fact that OPEC's current oil output isn't high enough to allow global oil importers to build their crude stocks ahead of the summer driving season.
Once again, the fundamentals of strong growth in demand, coupled with static to falling supplies, are supporting higher global oil prices. Add in continued unrest and weak output from Nigeria, terrorist attacks in Algeria and tension in the Middle East, and there are plenty of reasons to be concerned that supplies could be cut even further from current anemic levels.
This scenario brings us back to the Brent/WTI premium. Brent prices tend to be influenced more strongly by global supply-and-demand fundamentals than WTI. Global stocks of refined products and oil are low; there's no crude oil inventory overhang as in the US.
OPEC production is also falling, raising the specter that oil inventories in Europe and Asia won't see a strong seasonal build-up this spring. The current tighter supply/demand environment accounts for Brent's unusual premium valuation to WTI.
When you couple the tight global supply/demand balance with the unusual refiner-induced crude build in the U.S, it's easy to see why Brent/WTI prices are acting so unusually.
What This All Means
The scenario I just outlined is extremely bullish for crude oil and refined products prices. However, the temporary weakness in WTI relative to Brent is significantly obfuscating this bullish picture for many US-based investors.
I'm looking for WTI prices to rise back to their traditional premium to Brent in the next few months. I'm also looking for both benchmark oil prices to rise well into the $70s per barrel by midsummer; I'm basing this projection not on any sort of one-off geopolitical event but simply on tightening supplies and rising demand.
Consider that US gasoline stocks are already ultra-low and dropping counter seasonally. To meet surging US gasoline demand, refiners will need to accelerate their gasoline production soon as the period of peak demand is now only a couple months away. With gasoline demand already strong, it looks like this could be another stronger-than-normal summer driving season.
Already some of the idled refineries are coming back on line, albeit at reduced capacity levels. Other refineries that have been undergoing prolonged maintenance this spring are also finally starting to produce gasoline. Think about the current situation from the refiners' perspective: They're looking at strong gasoline prices and some of the strongest refining economics in years.
They're also looking at rapidly falling gasoline inventories that will approach dangerous levels soon if the drawdown continues. US refiners are behind on demand and looking at a very profitable refining environment; they're going to produce at the maximum pace possible this spring. We're seeing the very early innings of this right now with refinery capacity utilization slowly ticking higher from low levels.
By definition, as refiners start producing gasoline, they'll be using up those crude stocks that have kept a lid on WTI prices this year. In fact, those stocks should draw down rapidly as the nation's refiners shift into high gear for summer. If, as I expect, gasoline demand remains solid, those inventories could quickly drop below average levels.
But with US oil benchmark (WTI) prices below prevailing international benchmark (Brent) levels, US refiners are going to have trouble finding any oil to import; better oil prices are available internationally than in the US. Of course, there are certain oil supplies (such as Venezuelan heavy crude) that are relatively captive to the US market. However, with WTI prices so far under international levels, it will be tough for the US to attract additional barrels.
It's simple economics: If the US is going to attract imports, US benchmark prices will need to rise toward international levels and WTI will have to close its discount to Brent.
Moreover, as US crude inventories start to draw lower and the nation begins importing again in earnest, this will represent another wall of demand for the international crude oil markets. In other words, strong US gasoline demand will eventually represent a strong draw on global crude oil supplies. Those supplies are already tight, and OPEC shows no sign of letting up on its campaign to cut output.
All told, I see this as a recipe for a significant rally in crude. In addition, such an environment is bullish for oil exploration and production activity levels. We've seen no letup in the red-hot pace of international drilling and exploration activity; I expect no such slowdown to develop. In fact, if anything, the current environment should accelerate global oilfield activity.
Speaking Gigs
I'd like to extend an invitation to all subscribers to join me in New York City on May 14-15 for the New York Hard Assets Conference at the Marriott Marquis on Times Square. There are some excellent speakers on the roster this year, and as always, I'm looking forward to meeting and speaking to subscribers. For more information and free registration, visit www.iiconf.com . Be sure to tell them I sent you.
By Elliott H. Gue
The Energy Letter
© 2007 Elliott H. Gue
Elliott H. Gue is editor of The Energy Letter , a bi-weekly e-letter as well as editor of The Energy Strategist , a premium bi-weekly newsletter on the energy markets. Mr. Gue is also associate editor for Personal Finance , where he contributes his knowledge of the energy markets.
Mr. Gue has a Master's of Finance degree from the University of London and a Bachelor of Science degree in Economics and Management from the University of London , graduating in the top 3 percent of his class. Mr. Gue was the first American student to ever complete a full degree at that university.
© 2005-2022 http://www.MarketOracle.co.uk - The Market Oracle is a FREE Daily Financial Markets Analysis & Forecasting online publication.


