


Credit Crisis Watch: Liquidiy Injections Starting to Thaw Credit Freeze
Interest-Rates / Credit Crisis 2009 Feb 04, 2009 - 04:48 AM GMT

 Are the various central bank liquidity facilities and capital injections having the desired effect of unclogging credit markets and restoring confidence in the world's financial system? This is precisely what the “Credit Crisis Watch” is all about - a regular review of a number of measures in order to ascertain to what extent the thawing of credit markets is under way.
First up is the LIBOR rate. This is the interest rate banks charge each other for one-month, three-month, six-month and one-year loans. LIBOR is an acronym for “London InterBank Offered Rate” and is the rate charged by London banks. This rate is then published and used as the benchmark for bank rates around the world.
After having peaked on October 10 at 4.82%, the three-month dollar LIBOR rate declined sharply to 1.08% on January 14, but the healing process has since not made headway, with the current rate at 1.23%. LIBOR is therefore trading at 98 basis points above the upper band of the Fed's target range - a great improvement, but still steep compared to an average of 12 basis points in the year before the start of the credit crisis in August 2007.
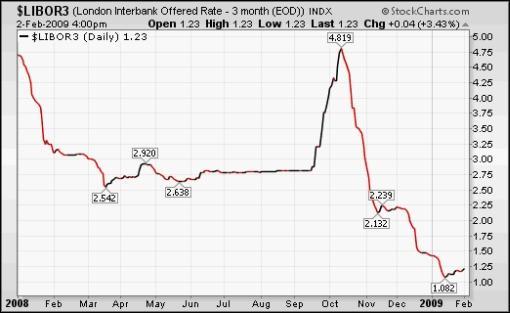
Source: StockCharts.com
Importantly, US three-month Treasury Bills have been heading higher, especially over the past few days, to 0.32% after momentarily trading in negative territory in December as nervous investors “warehoused” their money while receiving no return. The fact that some safe-haven money is now coming out of the Treasury market is a good sign.
US three-month Treasury Bill yield
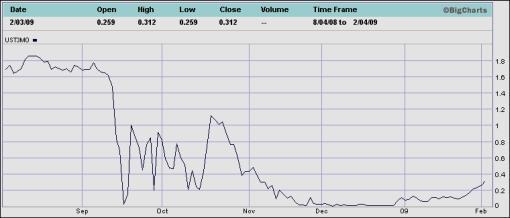
Source: The Wall Street Journal
The TED spread (i.e. three-month dollar LIBOR less three-month Treasury Bills) is a measure of perceived credit risk in the economy. This is because T-bills are considered risk-free while LIBOR reflects the credit risk of lending to commercial banks. An increase in the TED spread is a sign that lenders believe the risk of default on interbank loans (also known as counterparty risk) is increasing. On the other hand, when the risk of bank defaults is considered to be decreasing, the TED spread narrows.
Since the TED spread's peak of 4.65% on October 10, the measure has eased to a seven-month low of 0.91% - well above the 38-point spread it averaged in the 12 months prior to the start of the crisis, but nevertheless a strong move in the right direction.
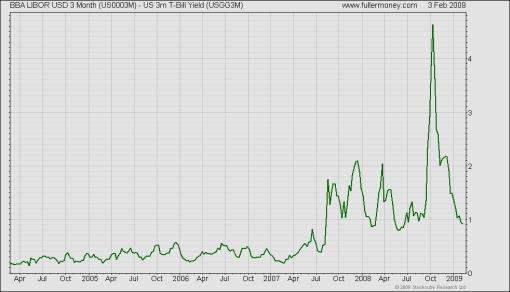
Source: Fullermoney
The difference between the LIBOR rate and the overnight index swap (OIS) rate is another measure of credit market stress.
When the LIBOR-OIS spread increases , it indicates that banks believe the other banks they are lending to have a higher risk of defaulting on the loans, so they charge a higher interest rate to offset that risk. The opposite applies to a narrowing LIBOR-OIS spread.
Similar to the TED spread, the narrowing in the LIBOR-OIS spread since October is also a move in the right direction.
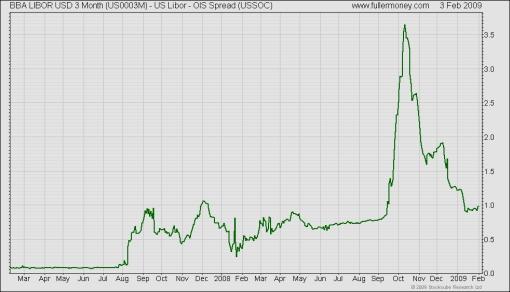
Source: Fullermoney
Despite the interbank lending rates having declined from their peaks, banks have significantly curtailed the amount of money they are actually lending. The US Depository Institutions Aggregate Excess Reserves continue their ascent at levels far in excess of the amount banks need to keep on deposit to meet their reserve requirements (see chart below). Although this measure recently started turning down, the level indicates that the balance sheets of banks remain under pressure, especially in view of the fact that the value of some assets is not known. As mentioned before, a definite peak in the Excess Reserves graph should coincide with a turning point in the recovery of banks.
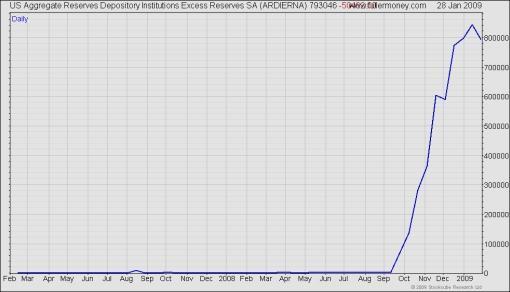
Source: Fullermoney
The spreads between ten-year Fannie Mae and other Government-sponsored Enterprise (GSE) bonds and ten-year US Treasury Notes have also compressed significantly during November and December, but have since kicked up again. However, to ensure the ultra-low rates on offer from the Fed are passed on to home buyers and those refinancing existing mortgages, mortgage spreads need to tighten further.
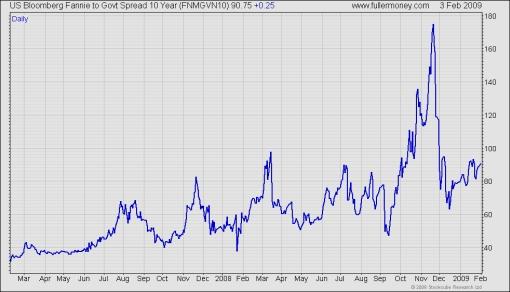
Source: Fullermoney
Higher Treasury rates resulted in the national average rate for a US 30-year fixed mortgage pushing up from 4.96% to 5.10% over the past two weeks (after hitting a peak of 6.46% in October last year). However, the lower rates are not being passed on to consumers, as seen from the 387 basis-point spread of the 30-year mortgage rate compared with the three-month dollar LIBOR rate. According to Bloomberg , this spread averaged 97 basis points during the 12 months preceding the crisis.
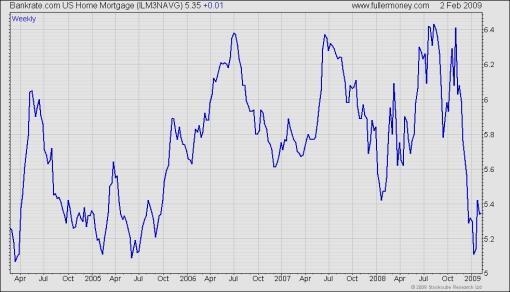
Source: Fullermoney
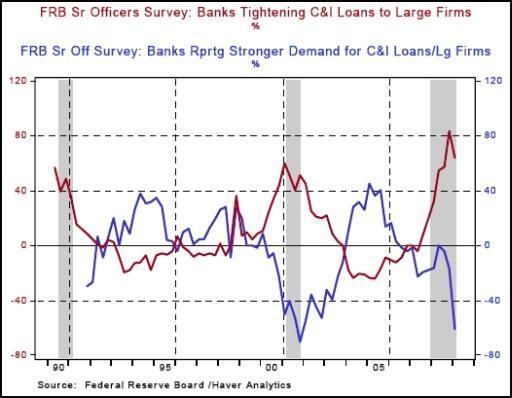
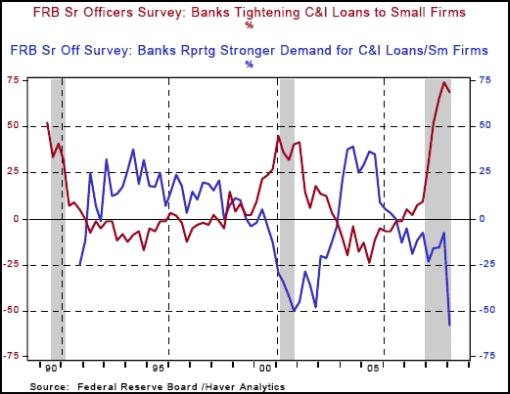
The Fed's Senior Loan Officer Opinion Survey of January 2009 contained indications of better tidings. Asha Bangalore ( Northern Trust ) said: “There were fewer bank officers reporting they had tightened loan underwriting standards for commercial and industrial loans for both small and large firms in January compared with December (see two charts below). In the case of both large and small firms, the demand for loans was weaker in January compared with December. Although the history of these data is short, in 2001, the demand for loans turned around only after the recession had reached its last leg, whereas the peak for the number of banks reporting tightening standards peaked slightly ahead.”
As far as commercial paper is concerned, the A2/P2 spread measures the difference between A2/P2 (low-quality) and AA (high-quality) 30-day non-financial commercial paper. The spread has declined markedly to 1.79% from almost 5% at the end of December.
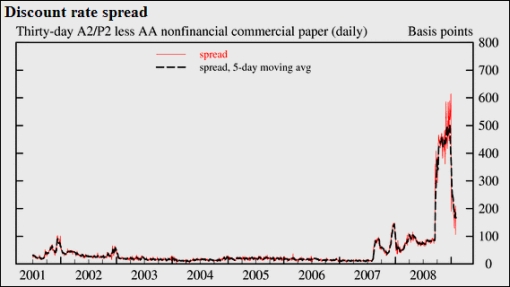
Source: Federal Reserve Release - Commercial Paper
Similarly, junk bond yields have also declined, as shown by the Merrill Lynch US High Yield Index. The Index dropped by 25.3% to 1,630 from its record high of 2,182 on December 15. This means the spread between high-yield debt and comparable US Treasuries was 1,630 basis points by the close of business on Tuesday. With the US 10-year Treasury Note yield at 2.89%, high-yield borrowers have to pay 19.19% per year to borrow money for a ten-year period. At these rates it is practically impossible for companies with a less-than-perfect credit status to conduct business profitably.
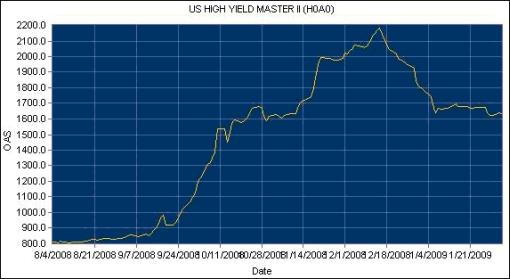
Source: Merrill Lynch Global Index System
The iBoxx Investment Grade Corporate Bond Fund (LQD) and High Yield Corporate Bond Fund (HYG) recovered strongly from their October/November lows until the beginning of 2009, but have since been correcting what appeared to be “too-much-too-soon rallies”.
The corporate bond sector is worth watching for opportunities arising at lower levels. Also, the high-yield instruments - under intense pressure because of an avalanche of defaults predicted by the ultra-wide spreads - could see spreads contracting markedly if the defaults are not as bad as those priced in.
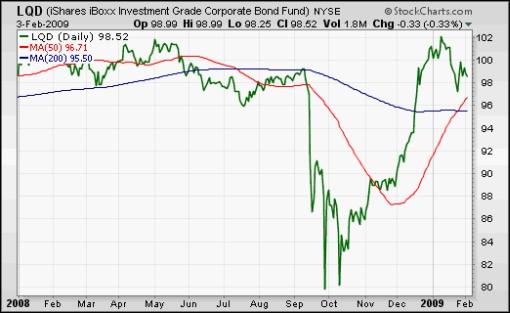
Source: StockCharts.com
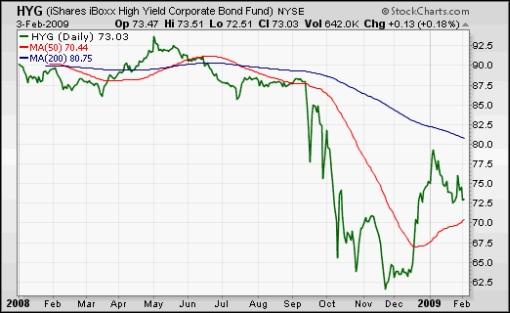
Source: StockCharts.com
Another indicator worth monitoring is the Barron's Confidence Index. This Index is calculated by dividing the average yield on high-grade bonds by the average yield on intermediate-grade bonds. The discrepancy between the yields is indicative of investor confidence. There has been an up-tick in the ratio since its all-time low in December, showing that bond investors are growing somewhat more confident and have started opting for more speculative bonds over high-grade bonds.
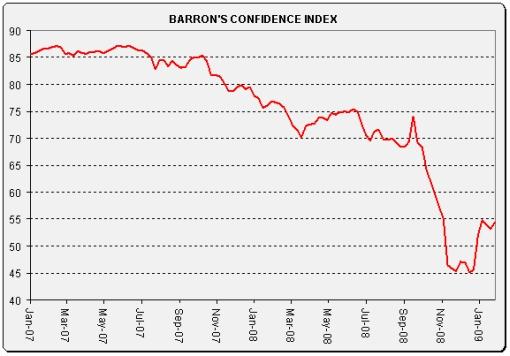
Source: I-Net Bridge
Goldman Sachs reports as follows: “Accounting for expected default losses, the premium in non-financial investment-grade bonds is several standard deviations above its 20-year mean. High-yield risk premiums are very high in absolute terms even taking into account a surge in default losses. But elevated sovereign spreads effectively put a floor on how much corporate spreads can rally this year.”
According to Markit , the cost of buying credit insurance for American and European investment-grade companies has declined strongly since the peaks of November. This is illustrated by the movement in the spreads (expressed in basis points) for the five-year credit derivative indices listed in the table below.
However, the debt of American and European high-yield companies, and all Asian and Japanese companies, has become dearer to insure. The increase of 196 basis points in the US CDX High Yield spread means an increased cost of $196 000 (up from $1,262,000 to $1,458,000) to insure $10 million of debt annually over five years.
• CDX (North America, investment-grade) Index: down from 218 to 196
• CDX (North America, high-yield) Index: up from 1,262 to 1,458
• Markit iTraxx Europe Index: down from 169 to 161
• Markit iTraxx Europe Crossover Index: up from 978 to 1,065
• Markit iTraxx Japan Index: up from 291 to 400
• Markit iTraxx Asia ex Japan IG Index: up from 307 to 363
• Markit iTraxx Asia ex Japan HY Index: up from 1,132 to 1,210
The graphs of the CDX indices are shown below, with the red line indicating the spread.
CDX (North America, investment-grade) Index
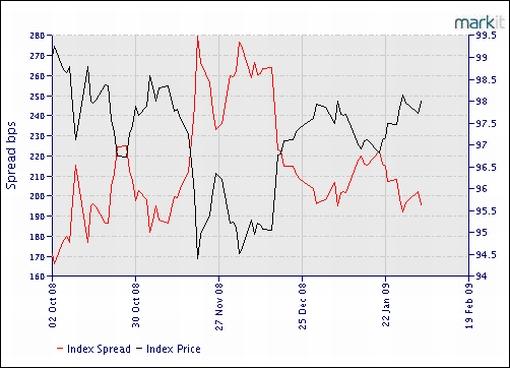
Source: Markit
CDX (North America, high-yield BB) Index
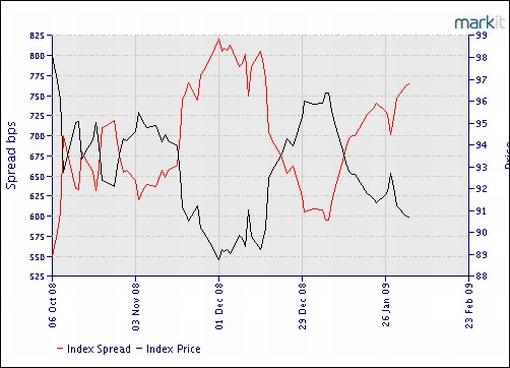
Source: Markit
Several firms have issued bonds at attractive yields over the past few days. “The success of these placings demonstrated that there is a market for new debt, but it has to come from high-quality issuers,” said Markit .
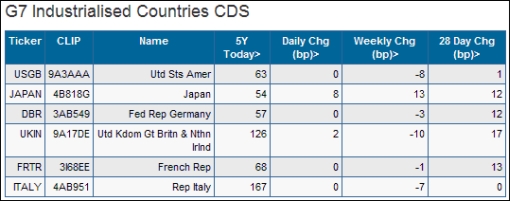
Lastly, the tables below show some country CDS statistics, again courtesy of Markit . These prices represent the cost per year to insure $10,000 of debt for five years. For example, Italy is in most trouble among the G7 countries with a cost of $167 per year to insure $10,000 of debt.
Among the G7 countries, it is noteworthy that Germany and Japan have a lower default risk that the US. It now costs $63 per year to insure $10,000 against US default for the next five years. Although this is down from $71 a week ago, the corresponding numbers were $8 early last year and $36 in November. As in the case of the US, UK CDS spreads are also trading close to record levels as investors are spooked by the levels of national debt.
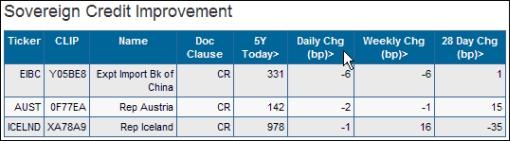
The price of insurance against debt default by Eurozone members Ireland, Greece, Italy, Spain, and even Belgium, has jumped in recent weeks, yield spreads against German bunds have ballooned, and the sovereign debt ratings of Greece, Portugal and Spain have recently been downgraded. According to Asha Bangalore ( Northern Trust ), “These developments do not reflect an increased risk of default by any Eurozone member, but rather show that investors have finally woken up to the fact that not all Eurozone sovereigns are equal. The global credit crunch has led to an overdue market re-evaluation of the Eurozone members.”
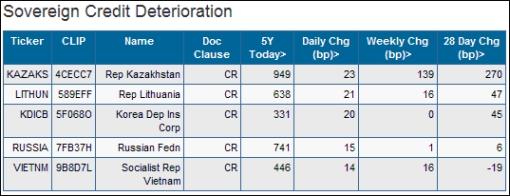
A marked deterioration was also seen over the past few days in the sovereign credit risk of, amongst others, Russia, Kazakhstan and Lithuania.
In summary, the past few months saw progress on the credit front, with a number of spreads having peaked. The TED spread (down to 0.91% from 4.65% on October 10), LIBOR-OIS spread (down to 0.98%% from 3.64% on October 10) and GSE mortgage spreads have all narrowed markedly since the record highs. Corporate bonds have also seen a strong improvement, but high-yield spreads remain at distressed levels.
Although the investment-grade credit derivative indices have mostly shown a tightening since the highs of November, the high-yield indices are in some cases still close to their peaks.
Over the past few days, US Treasury Bills have started moving higher as investors switched some Treasury money to less risk-averse investments.
The credit market tide seems to be turning, although additional data are required to confirm that the banking system is on the mend. In short, progress has been made, but the thawing of the credit markets has a way to go before liquidity starts to move freely and confidence returns to the world's financial system again.
Did you enjoy this post? If so, click here to subscribe to updates to Investment Postcards from Cape Town by e-mail.
By Dr Prieur du Plessis
Dr Prieur du Plessis is an investment professional with 25 years' experience in investment research and portfolio management.
More than 1200 of his articles on investment-related topics have been published in various regular newspaper, journal and Internet columns (including his blog, Investment Postcards from Cape Town : www.investmentpostcards.com ). He has also published a book, Financial Basics: Investment.
Prieur is chairman and principal shareholder of South African-based Plexus Asset Management , which he founded in 1995. The group conducts investment management, investment consulting, private equity and real estate activities in South Africa and other African countries.
Plexus is the South African partner of John Mauldin , Dallas-based author of the popular Thoughts from the Frontline newsletter, and also has an exclusive licensing agreement with California-based Research Affiliates for managing and distributing its enhanced Fundamental Index™ methodology in the Pan-African area.
Prieur is 53 years old and live with his wife, television producer and presenter Isabel Verwey, and two children in Cape Town , South Africa . His leisure activities include long-distance running, traveling, reading and motor-cycling.
Copyright © 2009 by Prieur du Plessis - All rights reserved.
Disclaimer: The above is a matter of opinion and is not intended as investment advice. Information and analysis above are derived from sources and utilizing methods believed reliable, but we cannot accept responsibility for any trading losses you may incur as a result of this analysis. Do your own due diligence.
Prieur du Plessis Archive |
© 2005-2022 http://www.MarketOracle.co.uk - The Market Oracle is a FREE Daily Financial Markets Analysis & Forecasting online publication.