


Critical Week for the Stock Market
Stock-Markets / Stock Index Trading Feb 03, 2009 - 05:23 PM GMTBy: Marty_Chenard

 It was on October 24th., that the VIX (Volatility Index) had hit its high. The VIX moves opposite to the market, so a high on the VIX should normally correspond with a low on the S&P 500.
But ... that wasn't the case. It wasn't until almost a month later that the S&P 500 finally hit its low. (The S&P low was on November 21st. ... at 11:30 AM on a 60 minute chart.)
That was an important event.
Why?
Because when the S&P finally hit is low, the VIX was showing a positive divergence with the S&P's low.
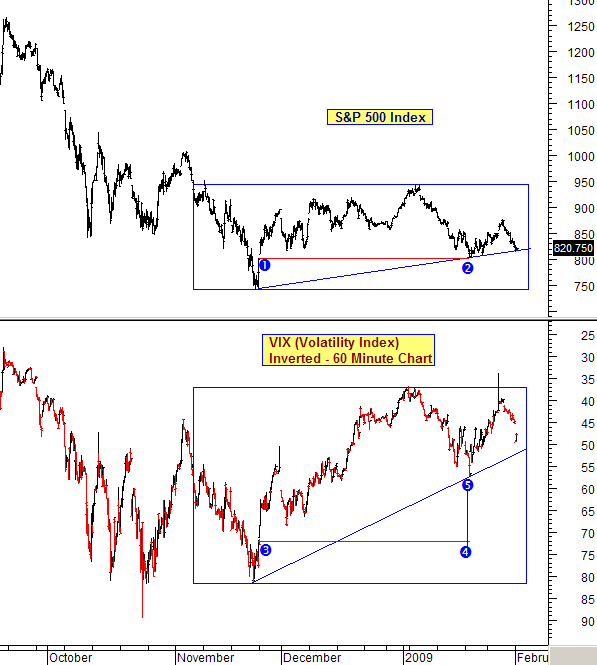
You can see that event on the chart below, where I inverted the VIX's chart so that it would track in the same direction as the S&P. (Remember, this means that as the VIX is moving higher on the chart below, that it is actually becoming numerically smaller since it is inverted. See the scale on the right hand side.)
So, that positive divergence set the VIX up to move higher on the inverted chart below (which was actually a move that would become numerically smaller). This became a positive event for the market since that November event.
Have we now come full circle since then?
Since November 21st., the S&P went up and then back down to close its Nov. 21st. gap. Now ... a multi-month decision is at hand.
Why?
Because the S&P 500 had set its support line when the gap was closed ... see labels 1 and 2 on the chart. At the open this morning, the S&P came down and rested on that important "support line". At the same time, the VIX gapped down this morning, but remained above its inverted support line. So, there was a positive divergence coming from the VIX.
One more thing to note: At label 2, the S&P came down even to label 1 and closed its gap. However, at the same label 2 point (which was label 4 on the VIX), the VIX wasn't even close to being at the same level. In fact, the VIX was way up at label 5 ... a huge positive divergence from the S&P's level.
So here is where we are today ...
1. The S&P is at a critical support level on a 60 minute chart, and that support goes back to last November.
2. The VIX has a positive divergence that was established on January 20th.
This means that we are going to have an important Bull vs. Bear battle this this week ... starting today. Two months of progress is at stake, so it will be important for the S&P to hold ... to hold first above today's support line, and then to HOLD its November low. Holding one or both would be in line with a basing process for the market.
Falling below the November low would be a act of losing the battle to the Bears ... which would mean exposing the markets to the possibility of making new lows. Like last night's Super Bowl, this could be an exciting week.
________________________________________________
*** Feel free to share this page with others by using the "Send this Page to a Friend" link below.
By Marty Chenard
http://www.stocktiming.com/
Please Note: We do not issue Buy or Sell timing recommendations on these Free daily update pages . I hope you understand, that in fairness, our Buy/Sell recommendations and advanced market Models are only available to our paid subscribers on a password required basis. Membership information
Marty Chenard is the Author and Teacher of two Seminar Courses on "Advanced Technical Analysis Investing", Mr. Chenard has been investing for over 30 years. In 2001 when the NASDAQ dropped 24.5%, his personal investment performance for the year was a gain of 57.428%. He is an Advanced Stock Market Technical Analyst that has developed his own proprietary analytical tools. As a result, he was out of the market two weeks before the 1987 Crash in the most recent Bear Market he faxed his Members in March 2000 telling them all to SELL. He is an advanced technical analyst and not an investment advisor, nor a securities broker.
Marty Chenard Archive |
© 2005-2022 http://www.MarketOracle.co.uk - The Market Oracle is a FREE Daily Financial Markets Analysis & Forecasting online publication.