


Catching the Stocks Bear Market Elliott Wave
Stock-Markets / Stocks Bear Market Jan 28, 2009 - 02:57 AM GMTBy: Weekly_Wizards

 When we last spoke you discussed how you use investor sentiment indicators ("dumb money") and institutional volume indicators ("smart money") in your analysis. But we'd like to understand more about your third component -- technical analysis -- specifically Elliott Wave?
Elliott Wave moves in 5-wave patterns, and identifying what wave we're in, and whether it's down or up, enables us to position ourselves to either buy the dips (if we're in an up-wave) or sell the rallies (down wave). For example, if the sentiment and volume indicators tell us we're overbought, and Elliott Wave analysis tells us we're in a down-wave, then we have a sell signal. And vice versa.
What kind of trend does your wave analysis tell us we're in?
If you take a big step back and look at markets from 10,000 feet, no matter what's taking place right now, we're in the process of Wave 4. This is considered a counter-trend move. Wave 5 would then follow the overall trend, which is down.
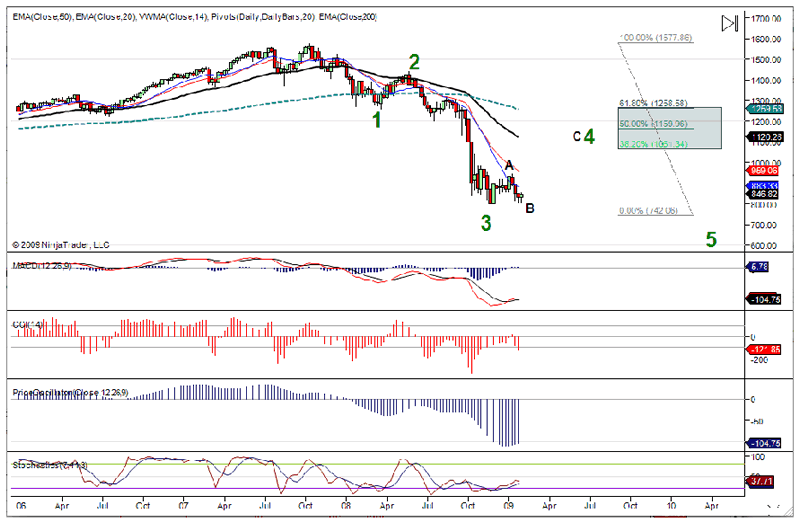
As we're in the middle of the wave, the S&P can go all the way back up to close to 1200, and we could still be in this Wave 4 up and still have a larger leg down. That's what I believe is playing out now. We're going to get a much larger leg up than many of the long-term or even the short-tem Elliott Wave counters are anticipating.
What are they saying?
A lot of them right now are basically saying that the 944 level that the S&P hit in early January was the top of Wave 4, and that we're now starting Wave 5 down, which should take the S&P all the way down to the 600 level. I'm not seeing that right now.
Why not?
The sentiment levels tell me there's still an overall bearish tone to the markets. The shorts are shorting this, because they're all waiting for that trip down to 600, but the markets are not going to crash when everyone is waiting for them to crash. And the institutional indicators confirm this. The smart money -- or puppet masters, as I call them -- just keep bidding the market up and don't allow it to crash. In addition, there is so much money that was taken out of the market in October and November from mutual funds and hedge funds that they're already out of the market. So I don't see that crash scenario playing out until at least half that money comes back into the market. And the only way they're coming back into the market is when they are convinced that the lows are in, and right now they're not convinced because you're not seeing a big inflow into mutual funds and hedge funds. They're just very scared. And that's when these stealth rallies hit the tape. It's when nobody's expecting them.
-----------------------------------------------------
Gary Dean's New ETF Service is Now Live!
Receive Gary's Analysis and Alerts throughout the day for trading ProShares Ultra Index ETFs
Share Ideas with and learn from a Community of Traders in his Chat Room
View his Nightly Video Report . . . and much more!
Sign up today for a Free 30-Day Trial!.
------------------------------------------------------
What do you see happening in the near-term?
Looking at "subwaves" within this larger Wave 4 count, we're in a small corrective downwave. The rally that started in November and ended in early January at 944 was the first subwave, or Wave A. Now we're making Wave B down, and the target I'd like to see hit to get aggressively long the markets is for the S&P to come down to 770-90 area. Though I'll chip away at very short-term trades in between, looking for a bounce to 875 or even the 890-900 area. After that 770-90 low, I see a Wave C up that's going to blow through the 944 level. My targets right now are somewhere around the 1000 all the way up to 1100 on the S&P, and I think that can play out all the way until summer.
After that?
At that time everybody will be convinced that we're done with this decline, and money will start flowing back into the market. Once they're all back in, that's when I believe we are going to get that larger Wave 5 down, and it's going to be a pretty nasty decline that will probably take us all the way into the 2012 timeframe.
What instruments do you use in your trading?
We use the QID to short the Q's and the QLD to go long at a 2 to 1 ratio. Same with the SDS and SSO for the S&P 500, and the DXD and DDM for the Dow. We focus on the general markets because it helps keep our work simple, and because our data follows that. The institutional buy/sell volume data measures the Nasdaq 100, the Dow and S&P 500 -- it doesn't measure block trades on the financials or other sector ETFs.
How has your performance been?
Since we started applying this system exclusively for these three ProShares ETFs on March 20 of last year, we had 94 winning trades out of 153 in 2008 for a total return of 298%. We've been most successful where we've used all the indicators rather than simply relying on wave count. Using Elliott Wave analysis to identify what wave we're in, and whether it's down or up -- and then overlaying the sentiment and institutional indicators to identify overbought and oversold areas -- we can get ahead of trend changes.
Gary Dean is founder of MarketsPath.com, a diary of his Ultra Index ETF analysis and trades. He uses a combination of Institutional Buy/Sell Volume ("smart money" indicator), Investor Sentiment ("herd" indicator) and expert Technical Analysis to identify where and when the markets will encounter a trend change before it happens! Dean developed his "ForeTrend" strategy in the mid-1990s, initially at JBHanauer in New Jersey, where he helped manage over $80 million with one of their largest brokers, primarily in equity options. For institutional volume, Dean uses proprietary software that measures the institutional block buy/sell volume on anywhere from a 1-minute to hourly to daily to weekly scale. For sentiment, he uses a system that analyzes the sentiment of over 200 different types of market participants, including stock brokers and money managers. For more about Gary's strategy, read our December 9 interview.
Gary Dean's new site is now live: Sign up for a Free 30-Day Trial to his MarketsPath.com Trade Journal, where you receive analysis and alerts throughout the day for trading ProShares Ultra Index ETFs.
http://www.advicetrade.com/Wizards
© 2002-2008 MPTrader.com, Weekly Wizards an AdviceTrade publication. All rights reserved. Any publication, distribution, retransmission or reproduction of information or data contained on this Web site without written consent from MPTrader is prohibited. See our disclaimer.
Weekly Wizards Archive |
© 2005-2022 http://www.MarketOracle.co.uk - The Market Oracle is a FREE Daily Financial Markets Analysis & Forecasting online publication.