Global Money Supply and the Value of Gold
Commodities / Money Supply Jan 27, 2009 - 02:11 AM GMTBy: Mike_Hewitt

 Mike Hewitt and Krassimir Petrov writes: Introduction - In this essay we attempt to estimate global money supply and relate it to global supply of gold. For the global money supply, we use money supply figures for currency in circulation from 86 selected currencies, from 81 independent countries and five monetary unions. For the global supply of gold, we use data from the World Gold Council (WGC). Finally, we attempt to interpret the price of gold as a relationship between global money supply and global gold supply.
Data Description
For money supply, we consider five monetary unions and 81 sovereign (independent) currencies. Here is a quick survey of those unions. The first monetary union is the European Monetary Union (EMU), commonly known as the Eurozone, and using the Euro as a common currency. It includes 16 Western European countries, such as Germany, France, Belgium, and Austria. The second currency union is the East Caribbean Currency Union, which uses the East Caribbean Dollar, and includes members like Antigua and Barbuda. The third union is the West African Monetary Union (UEOMA), using the West African Franc, and includes members like Benin and Burkina Faso. The fourth union is the Central African Monetary Union, technically known as CEMAC, which uses the central African Franc, and includes members like Cameroon, Chad, and Congo. The fifth union is technically known as the IEOM, uses the French Pacific Franc, and includes members like French Polynesia and New Caledonia.
Table 1 below, Currency Unions , provides the details for each currency union, such as its popular and technical name, its currency name, currency code, and member countries.
Table 1. Currency Unions
Monetary Union |
Currency Name |
Code |
Countries |
| Eurozone | Euro | EUR | Austria, Belgium, Cyprus, Finland, France, Germany, Greece, Ireland, Italy, Luxembourg, Malta, Netherlands, Portugal, Slovakia, Slovenia, Spain |
| East Caribbean Currency Union | East Caribbean Dollar | XCD | Anguilla, Antigua & Barbuda, Dominica, Grenada, Montserrat, Saint Kitts & Nevis, Saint Lucia, Saint Vincent & the Grenadines. |
| UEMOA ( Union Économique et Monétaire Ouest Africaine , or “West African Economic and Monetary Union”) | CFA franc BCEAO (West African Franc) | XOF | Benin, Burkina Faso, Côte d'Ivoire, Guinea-Bissau, Mali, Niger, Senegal, and Togo |
| CEMAC ( Communauté Économique et Monétaire de l'Afrique Centrale , or “Economic and Monetary Community of Central Africa”) | CFA franc BEAC (Central African Franc) | XAF | Cameroon, Central African Republic, Chad, Republic of the Congo, Equatorial Guinea and Gabon |
| IEOM ( Institut d'Émission d'Outre-Mer , or “Overseas Issuing Institute”) | CFP franc (French Pacific Franc) | XPF | French Polynesia, New Caledonia, and Wallis & Futuna |
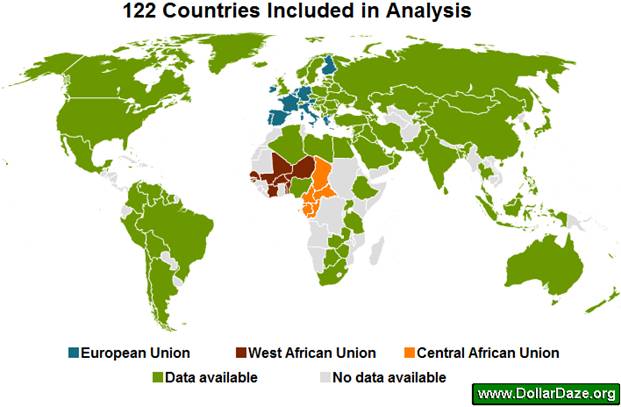
The five currency unions and 81 independent currencies cover a total of 122 countries that make up 98.4% of the world's GDP and 86.1% of the world's population . Figure 1 below visualizes the coverage. Areas with grey color on the map represent countries without available data. Areas with blue, red, and orange color represent the three most important economic unions, respectively the European, the West African, and the Central African Unions.
Figure 1. Countries Included in the Analysis.

Reliable money supply data could not be found for all countries. The five largest economies for which data was unavailable were: Morocco, Vietnam, Angola, Sudan, and Cuba. These countries comprise 0.6% of world GDP and 2.8% of world population. Their relatively insignificant share of the global economy makes us believe that their exclusion from our analysis would not materially affect our results and our conclusions.
Myanmar (Burma) requires a special note. Cross-country money supply comparisons rank Myanmar very high. This apparent paradox arises from the discrepancy between the overvalued official exchange rate and the more realistic “black market” exchange rate. For the local currency, the 2005 money supply is reported at 1.83 trillion kyat (MMK). The official exchange rate (6.7147 MMK to 1 USD) makes this the fifth most valuable currency in the world with a value of US$273 billion. The unofficial black market exchange rate (1300 MMK to 1 USD) provides a value of only US$1.4 billion. In our opinion, the official rate overvalues the currency roughly 200 times and introduces an obvious bias in the data, so Myanmar money supply was not included.
Monetary Aggregates
The Bank of International Settlements (BIS) provides a link on their website that lists central banks for different countries . The following charts and tables use money supply data from these official websites, whereby each link identifies the economic area
Unfortunately, there is no unified methodology for calculating different monetary aggregates. This presents analytical problems as different countries use different definitions of money supply. Different definitions, in turn, require different methodologies for calculating different monetary aggregates, which immensely complicates cross-country comparisons. Unfortunately, we are not aware of any widely accepted solution to this particular problem.
Quite commonly, money is conceptually defined across a continuum from narrow money to broad money. Narrow money typically includes highly liquid forms of money that serve the function of medium of exchange, while broad money additionally includes other less liquid forms of money that serve the function of store of value. Monetary aggregates are conventionally denoted in ascending order by M0, M1, M2, M3, etc. Smaller aggregates like M0 and M1 correspond conceptually to narrow money supply, while larger aggregates like M2 and M3 correspond to broad money supply. We should note that in the heady days of monetarism, economists have further elaborated those aggregates and have devised M4, M5, M6, etc.
Most generally and most commonly, but not necessarily uniformly, M0 refers to outstanding currency (banknotes and coins) in circulation, but excluding cash reserves. M1 includes M0, demand deposits, and cash reserves. M2 includes M1 and savings deposits, conventionally maturing within two years or redeemable at notice within three months. M3 includes M2, repurchase agreements, money market funds, and debt securities maturing within two years.
Additionally, not every country publishes all four of the common monetary aggregates. For example, the U.S. Federal Reserve ceased publishing M3 on May 23, 2006 . However, various independent sources have successfully reconstructed the M3 series and have continued to publish it.
For our analysis, we concentrated exclusively on the narrowest measure of money supply, M0. Conceptually, it corresponds best to the monetary interpretation of gold. We expect it to relate well to the value of gold, although further studies may be necessary to analyze the relationship of gold to higher aggregates, such as M1, M2, and M3.
Global Currency Comparisons
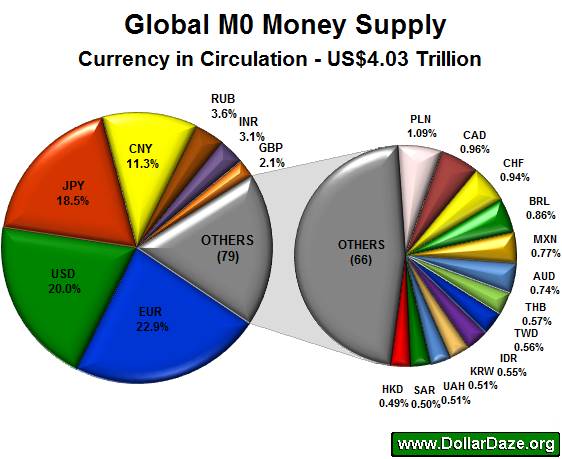
The following pie charts on Figure 2 below show the relative value of global currencies (M0) when converted to USD for means of comparison.
Figure 2. Global Narrow Money Supply

The left-hand side of the figure shows that the four largest currencies in circulation comprise nearly three-quarters of the global narrow money supply. Not surprisingly, those currencies are the Euro, the Dollar, the Yen, and the Yuan. The right-hand side zooms in on the “other” 79 currencies of the left-hand side that were simply too small to see when shown together with the big currencies. We show then next thirteen most important currencies that comprise in value more than half of the “other” category. It is clear from the picture that those thirteen currencies are really small relative to the big currencies. Nevertheless, it illustrates well their relative size in the global money supply.
Next, we consider narrow money supply growth rates. For the whole dataset, the average growth rate of M0 is 8.2%. Table 2 below shows the twelve currencies with the fastest annual growth rates of M0, shown in the middle column highlighted in yellow:
Table 2: Fastest Growing Currencies in Relative Terms
RANK |
COUNTRY |
CURRENCY CODE |
Y-O-Y INCREASE IN M0 |
EXCHANGE RATE |
||
| BILLIONS | % | US$ BILLIONS | ||||
| 1 | Zimbabwe | ZWD | > 900,000,000 | > 2 x 10¹⁶% | 0.02 | * |
| 2 | Azerbaijan | AZN | 1.49 | 69.7% | 1.85 | 1.235330 |
| 3 | Ukraine | UAH | 47.28 | 47.8% | 7.16 | 0.151403 |
| 4 | UAE | AED | 10.67 | 44.1% | 2.90 | 0.272000 |
| 5 | Estonia | EEK | 12.86 | 42.3% | 1.07 | 0.083263 |
| 6 | Indonesia | IDR | 62,839.00 | 39.2% | 6.31 | 0.000100 |
| 7 | Bangladesh | BDT | 109.66 | 39.0% | 1.59 | 0.014468 |
| 8 | Belorussia | BYR | 1,100.70 | 35.0% | 0.52 | 0.000473 |
| 9 | Zambia | ZMK | 404.39 | 33.2% | 0.09 | 0.000211 |
| 10 | Nigeria | NGN | 171.81 | 30.1% | 1.45 | 0.008423 |
| 11 | Venezuela | VEF | 3.56 | 29.5% | 1.66 | 0.465700 |
| 12 | Iran | IRR | 15,874.70 | 29.3% | 1.58 | 0.000099 |
* The Reserve Bank of Zimbabwe ceased publishing any statistics after June 2008 at which point 1 USD equalled 40.9 billion Zimbabwe dollars.
It is clear from the above table that while their growth rates are relatively high, they are also relatively small in absolute terms, and subsequently relatively insignificant.
On the other hand, when converted to US dollars as of Oct 31, 2008, the fastest growing currencies in absolute terms are shown in Table 3 below.
Table 3: Fastest Growing Currencies in Absolute Terms
RANK |
COUNTRY |
CURRENCY CODE |
Y-O-Y INCREASE IN M0 |
EXCHANGE RATE |
||
| BILLIONS | % | US$ BILLIONS | ||||
| 1 | EU | EUR | 81.20 | 13.2% | 107.59 | 1.324990 |
| 2 | China | CNY | 298.22 | 10.5% | 43.61 | 0.146224 |
| 3 | US | USD | 34.20 | 4.50% | 34.20 | 1.000000 |
| 4 | Russia | RUB | 683.30 | 21.2% | 25.79 | 0.037738 |
| 5 | India | INR | 1,050.63 | 20.8% | 21.66 | 0.020617 |
| 6 | Poland | PLN | 30.29 | 30.9% | 11.22 | 0.370290 |
| 7 | Japan | JPY | 811.60 | 1.13% | 8.11 | 0.009995 |
| 8 | Brazil | BRL | 16.48 | 25.1% | 7.57 | 0.459330 |
| 9 | Ukraine | UAH | 47.28 | 47.8% | 7.16 | 0.151403 |
| 10 | Indonesia | IDR | 62,839 | 39.2% | 6.31 | 0.000100 |
| 11 | UK | GBP | 2.85 | 4.50% | 4.80 | 1.683800 |
| 12 | Switzerland | CHF | 5.43 | 13.0% | 4.75 | 0.874520 |
From the comparison of the above two tables, it is quite obvious that the rapidly inflating currencies are relatively small to affect global money supply growth rates. From the second table it is clear that the “big” currencies contribute the bulk of increases in the global money supply. From this particular analysis we can conclude that a sample of the biggest 10-15 currencies in the world can provide a meaningful approximation of the growth rate of global money supply.
Money Supply vs. Gold Supply
It is estimated by the WGC that a total of 165,547 tonnes of gold have been mined. This is equivalent to about 5.32 billion ounces. Most of that gold is currently available as supply at some price, possibly much higher than the current market price. Given that the total gold supply is relatively stable and that very little gold is consumed in industrial processes, the annual increase in the supply of gold from current mining is relatively stable -- about 1.5%.
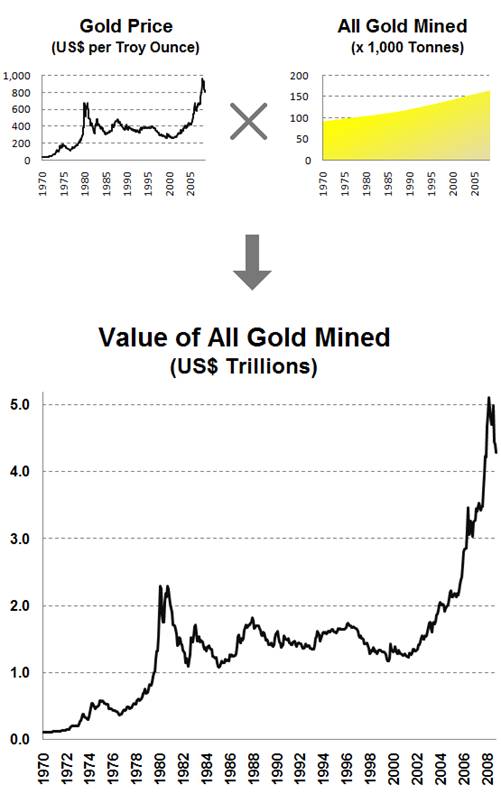
Figure 3 below shows the calculation of the value of all gold ever mined. The top left graph in the figure shows the price of gold for the period of 1970-2008. The top right graph in the figure shows the quantity of all gold mined for the same period. Finally, the bottom graph in the figure shows the product of the price with the quantity, which represents the value of all gold ever mined.
For example, the 10-31-2008 closing spot price for one troy ounce of gold was US$806.62. Multiplied by the corresponding quantity, the total value of all gold ever mined was US$4.3 trillion. This is just slightly more than the $4.03 billion global M0 money supply from Figure 2 above.
Figure 3. Global Value of Gold

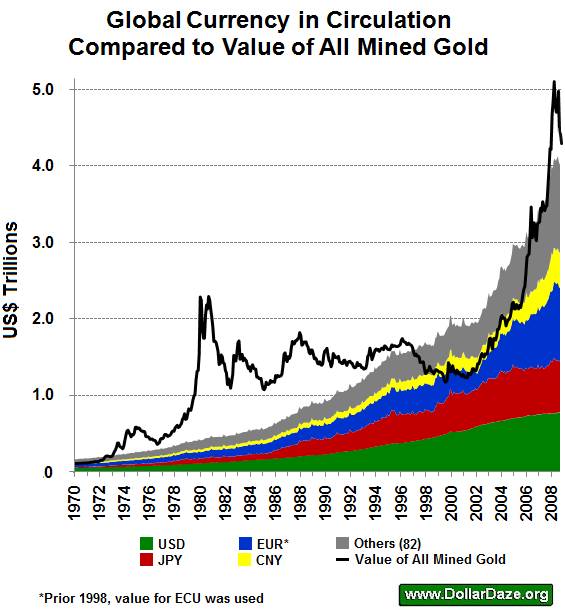
Figure 4 below shows a historical comparison for the value of mined gold against that of currency in circulation. This chart essentially overlays our previous data on global money supply with the data on the value of gold. It provides the basis for our valuation of gold.
Figure 4. Global Money Supply vs. Global Value of Gold

Gold Valuation
The period from 1945 to 1971 is widely known as the “Bretton Woods” era. The chief aim of the Bretton Woods Agreements was to establish the rules for commercial and financial relations among the world's major industrial states. The policy required that each country maintained the exchange rate of its currency within a fixed value—plus or minus one percent – to the U.S. dollar, which in turn would be convertible to gold at the rate of US$35/oz for foreign governments. The system collapsed when President Nixon took the US dollar off the gold standard on Aug 15, 1971 in response to growing demands from foreign governments to exchange their paper dollars for US Treasury gold. At that time there was some speculation by professional economists and Wall Street that the price of gold would collapse as the US dollar ‘would no longer hold it up'. In reality, just the opposite occurred – not only did gold not collapse, but instead it began a multi-year bull market, reaching an intraday peak of US$873 a troy pounce on January 21, 1980.
Our analysis essentially begins approximately with the collapse of Bretton Woods. The first major observation is that during the 1970s, gold advanced much farther than money supply. There are two fundamentally different explanations for this phenomenon. The first explanation, espoused by neoclassical economists, is that gold is inherently more volatile and more unstable than paper currencies. The other explanation, espoused by Austrian economists, is that gold is inherently stable and that paper currencies are inherently unstable, so that the high volatility of gold reflects the discounted value of expected future inflation. In other words, Austrians contend that the monetary policy associated with paper currencies is inherently unstable, and this instability of paper currencies is magnified when discounted to the current price of gold; this discounting mechanism generates the apparent excessive volatility of gold.
The second fundamental observation is that during the 1970s, gold rose at significantly faster rates than money supply. Necoclassicals explain this with the inherently volatile nature of gold. However, volatility simply cannot explain this 10-year trend. Volatility relates to variability in prices around the trend, not to the direction of the trend. Neoclassical economists have no meaningful explanation here, except to resort to volatility of gold and irrational behaviour of gold “investors”. On the other hand, the explanation by Austrians is straightforward and logical, as inflation accelerated throughout the 1970s, the discounting mechanism of the gold market resulted in accelerating price of gold from the rising inflationary expectations.
The third fundamental observation is that there is a possibility for a long-term divergence between the value/price of gold and global money supply. This divergence is obvious for the period of 1980-2000. The neoclassical school has not offered a satisfactory explanation of this phenomenon except to point out disparagingly that gold is a “barbarous relic”, “irrelevant” or “dead”. The Austrian explanation, however, is again quite straightforward: the period was generally characterized by disinflation, so the discounting mechanism produced lower gold prices due to the falling inflationary expectations that more than offset increases in money supply.
Conclusion
This analysis leads us to speculate that while divergences caused by inflationary expectations can last for a very long time, even decades, the long-term price of gold is driven by global money supply.
Resources:
As an interesting aside, one may note that the present US debt of US$10.5 trillion easily exceeds the value of ALL circulating currencies in the world PLUS the value of all gold ever mined! A naive person may wonder just exactly how the American government ever intends to pay this debt off...
It was illegal for Americans to own gold for investment purposes since President Roosevelt signed Executive Order 6102 on April 5, 1933. It wasn't until Dec 31, 1974 when Americans could own once again own gold coins, bars and certificates.
In nominal terms, gold did not surpass this level until Jan 8, 2008 – nearly some 28 years later.
By Mike Hewitt
http://www.dollardaze.org
Mike Hewitt is the editor of www.DollarDaze.org , a website pertaining to commentary on the instability of the global fiat monetary system and investment strategies on mining companies.
Disclaimer: The opinions expressed above are not intended to be taken as investment advice. It is to be taken as opinion only and I encourage you to complete your own due diligence when making an investment decision.
Mike Hewitt Archive |
© 2005-2022 http://www.MarketOracle.co.uk - The Market Oracle is a FREE Daily Financial Markets Analysis & Forecasting online publication.


