


Gold Trending Higher, Gold Stocks Soaring Through the Roof
Commodities / Gold & Silver 2009 Jan 24, 2009 - 07:07 PM GMTBy: Merv_Burak

 Since making its low last October gold has been making higher highs and higher lows. Friday took gold into new high territory since that October low point. It still has some hurdles to go through but let's see where this takes us.
GOLD : LONG TERM - First, there is that very long term chart shown last week. With this past week's action the price of gold is getting closer and closer to the point when this chart will turn back into the very long term bullish camp, but not quite yet. The gold price would have to close this coming week at or above the $928 level before the moving average will turn to the up side. Should that occur, the price would have to keep climbing for the following 5 weeks and make it into new high territory to keep that bullish rating intact? Otherwise we could have a few weeks when this rating could be in for some whip-saws.
Of the various charts and indicators that I use for my analysis the point and figure (P&F) chart seems to be giving us the best picture. It turned around and gave us a long term bull signal on 21 Nov 2008 after breaking out of its lateral activity and starting its rally. With an initial projection of $930, which seems very close to being achieved, the P&F chart has remained right on track.
As for the normal indicators, gold is now above its long term moving average line. The line had turned and was progressing in a horizontal direction but after the Friday's action it turned upwards. The momentum indicator is just inside its positive zone and above its positive trigger line. The volume indicator is showing strength and is moving into new high levels since the rally started. It also remains above its positive trigger line. The long term rating is therefore upgraded to the BULLISH level.
INTERMEDIATE TERM
Things continue to look good from the intermediate term stand point. The price of gold zoomed into new highs and well above its positive moving average line. The momentum indicator is moving higher into its positive zone and still has plenty of room for further upside movement. It is above its positive trigger line. The volume indicator continues its upward trek above its positive trigger line. All is in place for a continuation of the intermediate term BULLISH rating.
SHORT TERM
As expected we're getting another bounce in the price of gold as it sets its sights on the upper channel trend line. All indicators are on track for a continuation of the upward move. The price
is above its short term moving average line and the line is in a positive slope. The very short term moving average line has once more moved above the short term line to confirm a short positive move in progress. The momentum indicator is inside its positive zone and moving nicely higher above its positive trigger line. The daily volume activity continues to improve and is pulling up the 15 day average volume figure. The short term continues to be BULLISH .
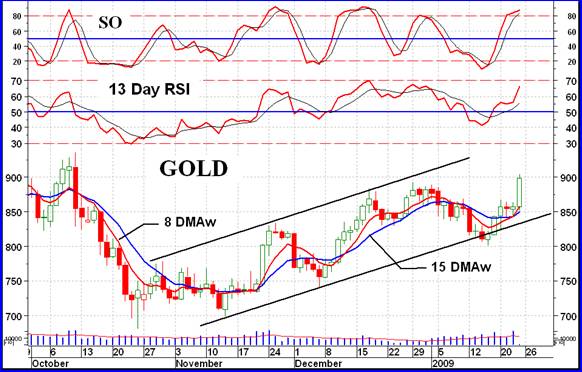
As for the immediate term direction of least resistance, well that would be to the up side. However, with the aggressive Stochastic Oscillator (SO) already in its overbought zone and starting to flatten out one might be prepared for a possible lateral trend or even a reaction in the price very soon.
SILVER
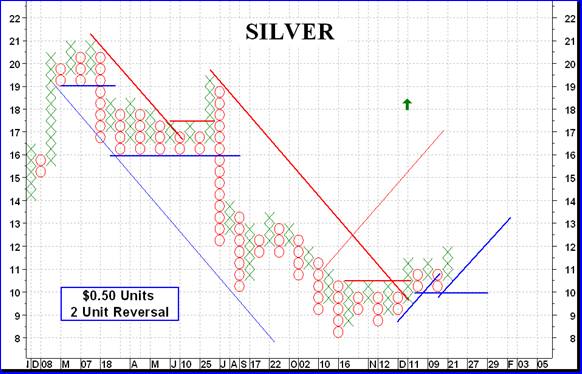
Although still under performing gold from a long term perspective, silver is bettering gold's performance over the intermediate and short term. With an initial P&F projection of $18.50 silver still has a potential 50% move ahead of it. As with gold silver has moved into new recovery highs with its Friday action. The intermediate term momentum has once more reared its indicator into the positive zone and the volume indicator continues to move higher and higher, almost non stop. On a bar chart silver, as with gold, is also trapped inside an up trending channel. However, with the silver channel the latest price is just about touching the upper (resistance) channel trend line. This could suggest a coming rest period for the move, or a breaking of the channel. I'll go with the breaking of the channel line.
Although gold seems to have little industrial use silver, on the other hand, has many industrial uses and very often moves on the ups and downs of the world economy. My curiosity today is that the economy seems to be in disarray so why is silver showing strength?
Precious Metals Stocks
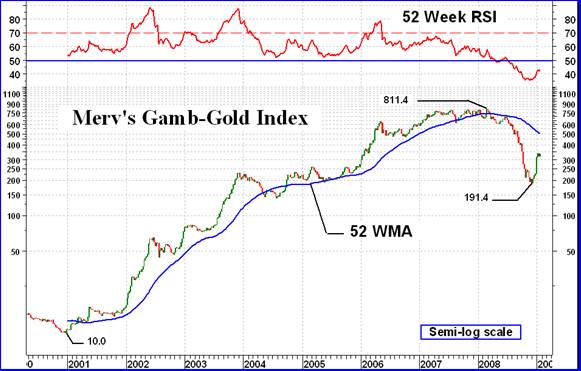
Gold and silver may be moving higher but oh so many gold and silver stocks are going through the roof. The chart of the Merv's Gamb-Gold Index, my Index of the gambling variety of stocks, shows that the average price of the 30 gambling stocks in this Index are up 75% since hitting bottom in the first week of Dec.. The quality stocks did a little better with a 79% gain during the period. The whole universe of 160 stocks had about the same performance with a 74% gain. The gold and silver stocks were really moving as the general market as a whole was tanking. It's interesting to note that for these 160 gold and silver stocks, 100 of which are the largest 100 companies in the business, over the past 50 days their performance was really great. The top 25 performing stocks during this 50 day period had gains of 252% on the high end and 75% on the low end with an average for all 25 stocks at 121%. Now the question is, “Will the trend continue?”
Looking over the intermediate and long term indicators and charts everything looks okay for still further gains ahead. It will not be all straight upwards. There will be periods of reaction when things go lower for a while but in general the path ahead does look encouraging.
The one cautionary chart and indicators is the very long term as represented in the Gamb-Gold Index shown today. Although the long term Table ratings for the Indices are already bullish (POS), as are most of the intermediate term Indices the very long term still has a ways to go before it turns bullish. The Index is still some distance from its one year moving average line and the momentum indicator is not showing much strength in the movement so far. It's going to take some time, with the Index possibly moving sideways, before the very long term goes bullish.
However, as long as things are going in the right direction, go with the flow.
Merv's Precious Metals Indices Table
Let's call it another week
By Merv Burak, CMT
Hudson Aero/Systems Inc.
Technical Information Group
for Merv's Precious Metals Central
For DAILY Uranium stock commentary and WEEKLY Uranium market update check out my new Technically Uranium with Merv blog at http://techuranium.blogspot.com .
During the day Merv practices his engineering profession as a Consulting Aerospace Engineer. Once the sun goes down and night descends upon the earth Merv dons his other hat as a Chartered Market Technician ( CMT ) and tries to decipher what's going on in the securities markets. As an underground surveyor in the gold mines of Canada 's Northwest Territories in his youth, Merv has a soft spot for the gold industry and has developed several Gold Indices reflecting different aspects of the industry. As a basically lazy individual Merv's driving focus is to KEEP IT SIMPLE .
To find out more about Merv's various Gold Indices and component stocks, please visit http://preciousmetalscentral.com . There you will find samples of the Indices and their component stocks plus other publications of interest to gold investors.
Before you invest, Always check your market timing with a Qualified Professional Market Technician
Merv Burak Archive |
© 2005-2022 http://www.MarketOracle.co.uk - The Market Oracle is a FREE Daily Financial Markets Analysis & Forecasting online publication.