COT Warning of possible near-term top in Gold and Breakdown in Resource Stocks
Commodities / Gold & Silver Apr 23, 2007 - 11:40 AM GMTBy: Clive_Maund
Resource Stock investors have become increasingly excited as gold, silver and oil have advanced over the past 7 weeks or so, with the usual cheerleaders advancing plausible reasons why gold and silver will soon break out to new highs. However, as we will shortly see, big money is positioning itself to fleece the little guy yet again, with the same old music playing over, as it has done countless times in the past.
On shorter-term charts all seems to be OK - gold and silver were wildly overbought after their strong run in late 2005 and early last year, and were entitled to take a lengthy breather to let the extremely overbought condition unwind, and as they now approach the highs of last year they are nowhere near as overbought, and thus on the face of it, they appear to be ready to break to new highs at last.
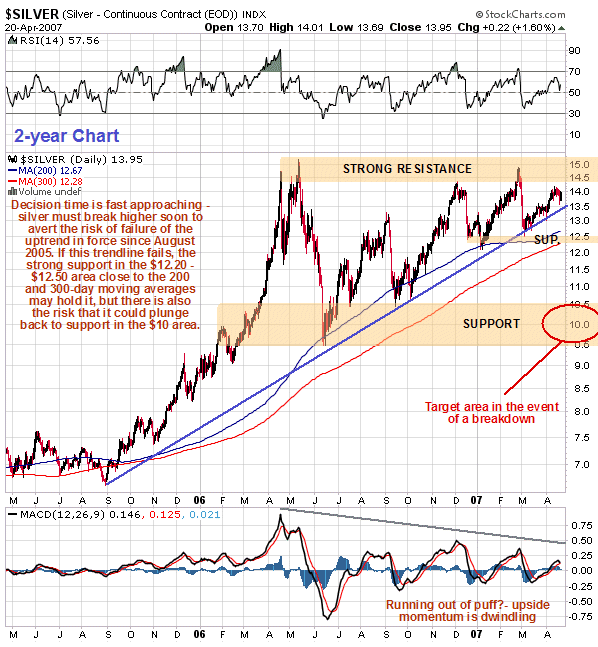
On the 2-year silver chart, however, although the uptrend shown can be seen to be holding thus far, there is a clear loss of upside momentum indicated by the succession of lower peaks made by the MACD indicator shown at the bottom of the chart, and on the 10-year silver chart included in latest Silver Market update the uptrend from September 2005 looks unsustainably steep, as does the parallel uptrend in gold. This increases the risk of a breakdown, which would lead at least to a more protracted period of consolidation before prices can challenge the highs, and it must be acknowledged that there is some risk of both gold and silver double-topping here with their highs of last year.

We are clearly at a pivotal juncture, with both gold and silver poised to either break out soon to new highs, or top out at or near those highs and break down, which would lead at best to more protracted period of consolidation before the highs could be challenged again, or at worst a bear market. So, which is it likely to be? - there must be something that can assist us in making a decision as to which of these scenarios is most probable. Fortunately, there is - the COT charts.

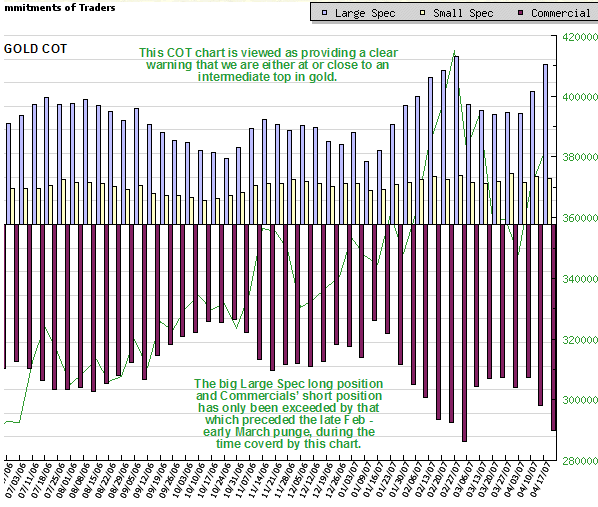
We have already observed the decidedly bearish COT chart for crude oil in the latest Oil Market update published yesterday, and as Precious Metals and Oil have a marked tendency to move in tandem, this is not a good omen. Bearing this in mind, we will now look at the COT chart for gold. On this chart we can see that the Large Spec long positions and Commercials' short positions are at their highest level since July last year, with the exception of a point late in February, which preceded a brief but quite severe plunge by gold and silver late in February and early in March. The writer does not know of an instance where such a setup was not followed by a significant reversal. It is viewed as VERY BEARISH, and the most that can be hoped for is that gold and silver edge still higher over the short-term towards last year's peaks, or even stage false breakouts above them, before the trap closes. The COT chart for silver is similar although it is not as bearish as the gold COT.

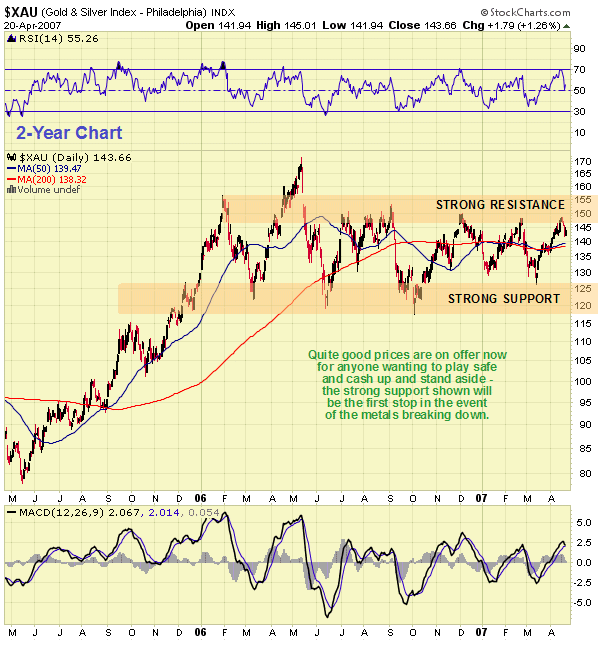
On the 2-year XAU index chart, we can see that although it has just backed off again from a key resistance level, good prices are still on offer for most gold and silver stocks. On the basis of what is written above and what is staring you in the face from the COT charts, you don't have to be Jesse Livermore to figure out the right course of action with regard to holdings in the sector.
Advice relating to specific stocks and Traded Options follows for subscribers…
By Clive Maund
CliveMaund.com
The above represents the opinion and analysis of Mr. Maund, based on data available to him, at the time of writing. Mr. Maunds opinions are his own, and are not a recommendation or an offer to buy or sell securities. No responsibility can be accepted for losses that may result as a consequence of trading on the basis of this analysis. Mr. Maund is an independent analyst who receives no compensation of any kind from any groups, individuals or corporations mentioned in his reports. As trading and investing in any financial markets may involve serious risk of loss, Mr. Maund recommends that you consult with a qualified investment advisor, one licensed by appropriate regulatory agencies in your legal jurisdiction and do your own due diligence and research when making any kind of a transaction with financial ramifications.
© 2005-2022 http://www.MarketOracle.co.uk - The Market Oracle is a FREE Daily Financial Markets Analysis & Forecasting online publication.


