


Stocks & Commodity Markets Elliott Wave Analysis - Nonstop, Straight to the Top
Stock-Markets / Elliott Wave Theory Apr 22, 2007 - 07:55 PM GMTBy: Dominick

I'm sure by now many traders have noticed what's really been going on. It sure does feel as though the capitulation phase I've been waiting to see may be upon us, as this was a brutal week for anyone stuck in a short position from the February top. Or from any of the inviting diversions along the rally from the March lows.
That's just the market doing what it's done ever since its doors opened – it'll get every bear to cover and stop shorting, while getting the late bulls long, as the train appears to be leaving.
So, it sounds like the next step will be easy enough right? Think again, because if it were, everyone would be on the same side and there wouldn't be a market. It's times like these that people like to say, “a market can stay overbought longer than you can remain solvent.” Shorting blindly into a blowoff market because it can't go up any further is a sure disaster for the trader. Having targets, patterns, unique indicators, and an “unbiased” approach is what's needed, and we have it. We have the tools and the momentum, and some of the smartest seasoned traders.
Last weeks update stated:
“We are once again close to a very important juncture, so close that it could be only a few hours away. The map that led us here continues to work perfectly, so we will continue to follow it. If correct, we don't have much to do but make money.
Does the next move become the capitulation stage or once again the talk of a 3rd of a 3rd of a 3rd? We believe we know that answer. Bearish sentiment continues to fuel this rally as short traders are forced to cover on each upside surprise. I will be monitoring option sentiment at our nearby target next week.”
Well, we were close alright! We didn't waste a minute gapping up 6 points on Monday and then continuing the grind higher, forcing shorts to cover yet again. Luckily, we weren't trapped into Monday's gap up as we had bought the 1452.50 low last Friday, though I'm sure some members took profit and some held. More importantly, we expressed that we didn't have a sell signal last Friday, so at the very least avoiding having Monday morning's gap up going against you is a great way to start the week.
Readers should remember the statement made from one of our noted market observers at the March lows. He had stated:
“When there have been two readings over 2.5 in the same decline, the market never closes lower than the day of the second reading and has always rallied more than it dropped.”
That promise was achieved this week as the S&P futures passed the February highs. That high also put a halt to traders that continued to push up their wave two bearish count, since wave two cannot make a new high. It's a shame that it took a 100 S&P points for many to see the correct trend and count.
Any member that took the long position for a swing trade and held it would have been up $ $29,500 per S&P contract! As a matter of fact, our target on this move has been 1494 on the S&P futures, 1 point from Friday close!
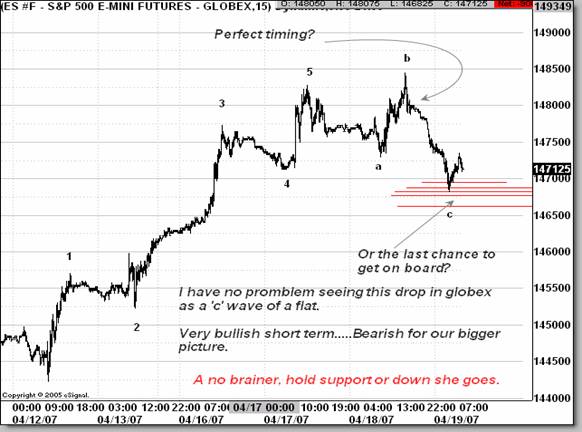
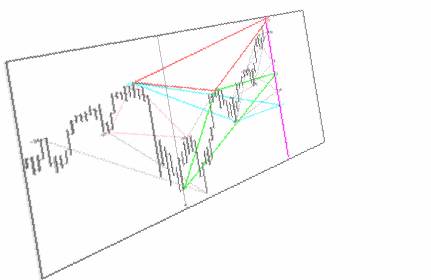
Our members that day trade are probably doing even better than that since we were really able to read this entire advance correctly. After issuing cautious comments on Wednesday's close for the first time, we instantly woke up to a huge gap down in the market. Most would have been content to just take credit for such a good call. I instead elected to buy the gap. Yes, buy it. A gap of that size changed the structure of the market from short term bearish, to very bullish short term. Reading the market structure correctly and being “unbiased” will award you like that. The chart below was posted at 8:23 am on Thursday along with this statement.
“Finding support in the shown area is a gift. We don't have a "must hold #" but that area has to hold to make this a great setup. Holding there will setup a rally into options expiry”.
That is exactly what it did. It closed at its high tick on Friday producing a gain of 20 + points in 13 hours.
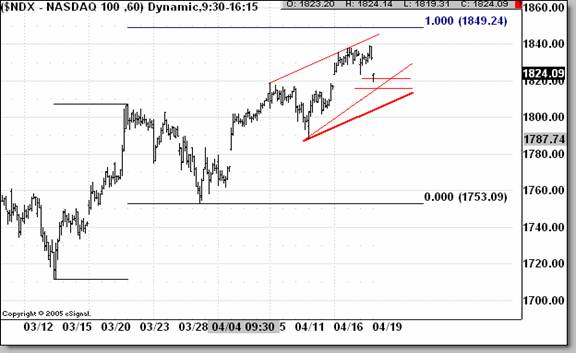
Another chart was posted on the NDX. Once again, the chart proved that knowing the developing pattern and holding no fixed bias will capture these everyday moves. Everyday. Below is that chart of the NDX showing the opening target and of course, where it would be wrong. The NDX found support exactly where expected and rallied almost 40 points to precisely our target for Friday's high.
The question now is whether we're making a run to the 2000 highs or this the prelude to a large decline? We continue to follow our original charts that have had 1494 as a target for the S&P futures. We know the small up/dn moves the market should (or shouldn't) do here and once again believe we could be hours away from another big juncture in the markets. We have a chart that points to Tuesday as a day to watch, If not, I'll meet you at our next turn on or about May 9 th , along with the Fed meeting and anniversary of the May 2006 high.
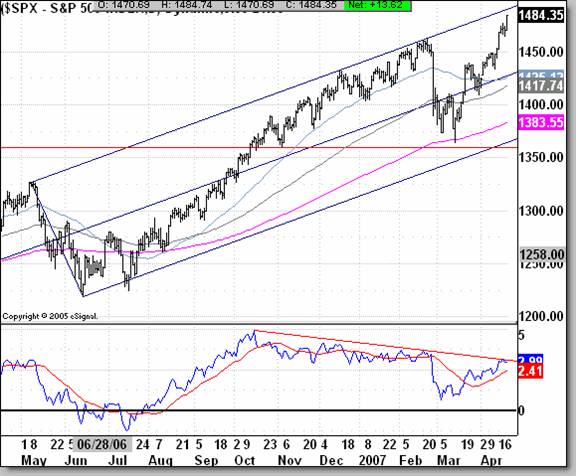
Below is a daily chart of the SPX showing trendline and technical resistance coming up. We will be sure to monitor this along with all our other daily tools.
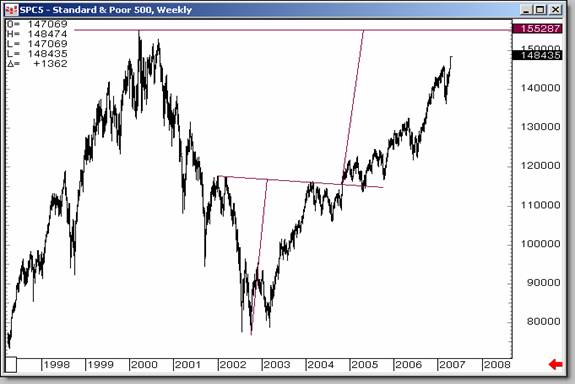
If you haven't made good profits this year, its time to really think about what you're doing wrong. Or should I say if you have watched or shorted a rally from the 2002 lows that has recovered all but 70 points of the its decline. If this is you, join now, become part of TTC, and get to understand why you are trading a certain side of the market and learn how to find the money. It's also a perfect time as we will be having a fee increase before the summer. Read below for details.
We will also be watching our European markets next week as they continue to push ahead to my “trade of the year” idea. Looking at the chart below shows you why we have such an interest in the Dax. Below is a weekly chart of the NYSE
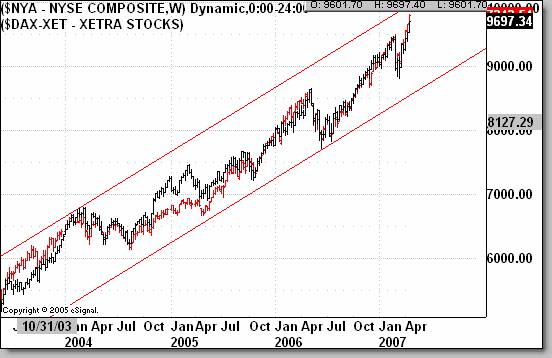
wth the Dax overlapped on top. Are they tracking each other or what?
The Dow maps that we've made since the March lows have rewarded our members nicely. The market hasn't even thought about putting them at risk since that low. But the smell of capitulation is in the air. After all, look at the chart below and tell me how a trader that's been on the wrong side of this market wouldn't finally throw in the towel?
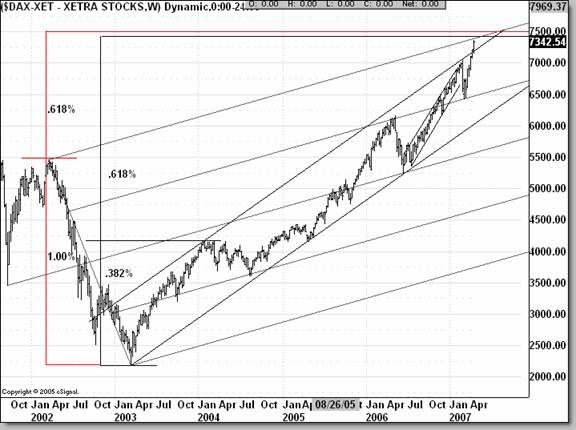
Europe
The Dax has been pulling us along their explosive ride the last few weeks. This is surely another index on our radar screen. We think we have the area it's targeting as shown in the chart below. If this is something you want to pay attention to, our members now have the trend charts on the Dax to use for their intraday trading. And trust me, these charts have saved many traders that were always quick on the sell button. The Dax forum has been growing nicely, we would love to have traders around the world join in and trade together in our great technical community. You can also take advantage of our chatroom, open 24/7.
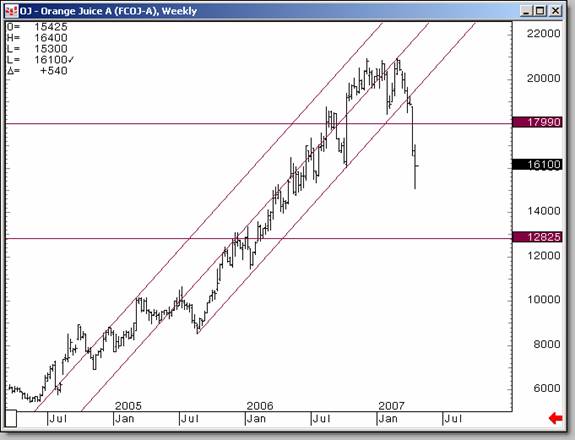
Softs
OJ continued to suffer as our short position gained. We were expecting a bounce which has seemed to have started.
Gold
Essentially, metals are neither at support or resistance, but despite a minor struggle last week, the trend continues to be up until it's not. Read Joe's Precious Points update for more information on the week in metals.
Members only
After another terrific week, we continue to fire on all cylinders and next week won't be any different. Most of you have my ideas for next week. If not, be sure to check all the updated charts this weekend as the next few weeks should be very Volatile. Below are the Dow maps we have been tracking. I replicated those charts for the S&P. Use the link below to see those charts.
Also check the chart our friend left for us in the Delta Forum. He has some Fib confluence showing up early this week on that chart.
To Current and Prospective Members:
TTC will be increasing it monthly subscription fee sometime before this summer. The increase has become inevitable due to our ongoing expansion of the Website, computer and software upgrades, and the addition of services such as trend cycle charts. Current members and anyone that joins before the increase takes effect will not be subject to the new price, and will continue paying the current $50 subscription fee on a month-to-month basis. So if you have been thinking of joining, this might be a great time.
Thank you for your attention to these changes. If there are any questions, please direct your email to admin@tradingthecharts.com .
Have a profitable and safe week trading, and remember:
“Unbiased Elliott Wave works!”
By Dominick
For real-time analysis, become a member for only $50
If you've enjoyed this article, signup for Market Updates , our monthly newsletter, and, for more immediate analysis and market reaction, view my work and the charts exchanged between our seasoned traders in TradingtheCharts forum . Continued success has inspired expansion of the “open access to non subscribers” forums, and our Market Advisory members and I have agreed to post our work in these forums periodically. Explore services from Wall Street's best, including Jim Curry, Tim Ords, Glen Neely, Richard Rhodes, Andre Gratian, Bob Carver, Eric Hadik, Chartsedge, Elliott today, Stock Barometer, Harry Boxer, Mike Paulenoff and others. Try them all, subscribe to the ones that suit your style, and accelerate your trading profits! These forums are on the top of the homepage at Trading the Charts. Market analysts are always welcome to contribute to the Forum or newsletter. Email me @ Dominick@tradingthecharts.com if you have any interest.
This update is provided as general information and is not an investment recommendation. TTC accepts no liability whatsoever for any losses resulting from action taken based on the contents of its charts, commentaries, or price data. Securities and commodities markets involve inherent risk and not all positions are suitable for each individual. Check with your licensed financial advisor or broker prior to taking any action.
© 2005-2022 http://www.MarketOracle.co.uk - The Market Oracle is a FREE Daily Financial Markets Analysis & Forecasting online publication.