Preparing Precisely for Financial Market Bottoms
Stock-Markets / Investing 2009 Jan 15, 2009 - 11:00 AM GMTBy: Oxbury_Research
 Let me ask you something. How many times have you heard a bottom called in a market...any market? I mean, it's amazing that not only are these people still allowed to publicly express their opinions, but people still listen to them as well.
It shouldn't be that surprising. Almost every Tom, Dick, and Harry with an Ameritrade or Schwab trading account doesn't have a clue what's going on in the stock market or any other financial market for that matter. So I guess the advisers and analysts that they get their advice from only have to be slightly more intelligent.
I'm not complaining. In fact, it's just the opposite. Financial markets are a zero sum game. For every 20% gain you have, the counter party in the trade loses 20%. So we should be thankful for bad analysts and worse investors. Just remember, wealth is never destroyed, only transferred.
Bottoms, Risk, and Asset Prices
I've discussed very little about market bottoms. I did discuss in a prior issue of B&B about a gold potentially forming a consolidated base that it could rally from, but that is the extent of it. I happen to have some very interesting insight on the coming market bottom, but to understand my hypothesis, we must first identify how we got here.
The road to DOW 7500 has been covered and analyzed rather extensively. Although it's been beaten to death, I would simply like to restate the driving force behind the decline of asset prices.
The cause was a deflationary process resulting from the de-leveraging of a financial system that was leveraged to extreme Keynesian standards. Leading the way in this massive margin call were the banks, hedge funds, and other investment fund. As these piles of money liquidated assets, risk was repriced into the markets. Hence we entered, and are currently in, a "preserve" instead of a "risk-taking" climate.
When risk reenters the market, we will set asset prices begin their next rally. I think we are nearing that point. I'm not calling a bottom yet, but I have two practical ways to identify when the risk is returning, which implies a bottom in asset prices.
Charting Bottoms
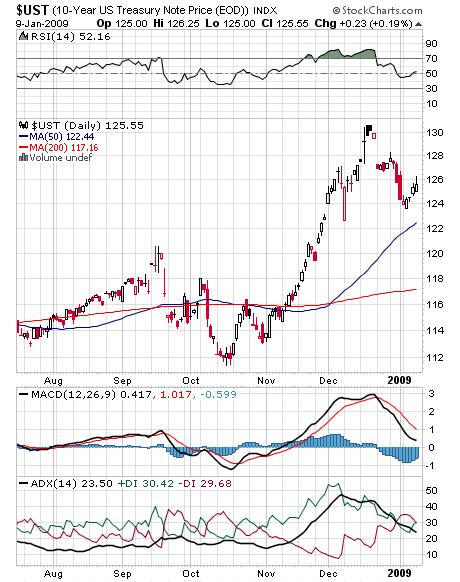
This first charts is the price of the 10-year Treasury Note:

Obviously you can see the fantastic run up in price. It's been well documented. But I'm not here today to talk about the Treasury market bubble and the growing liabilities of our nation. Before that bubble really pops we can use the 10-year Treasury price as an indicator of risk and tool to identify market reentry points.
You can see the pull back which has turned and rallied in sync with the decline in stock prices over the past week. What I'm looking for is a correction below the 50 day MA and a period of consolidation between the 50 and 200 day MA. I believe asset prices will begin to rise as that occurs.
Once we break support at the 50 day, looking at the chart you can see that there really isn't any support until 120. Beyond that, it's hard to say. When the bond bubble pops, the Treasury market may no longer be a good judge of risk. I have another chart that should help
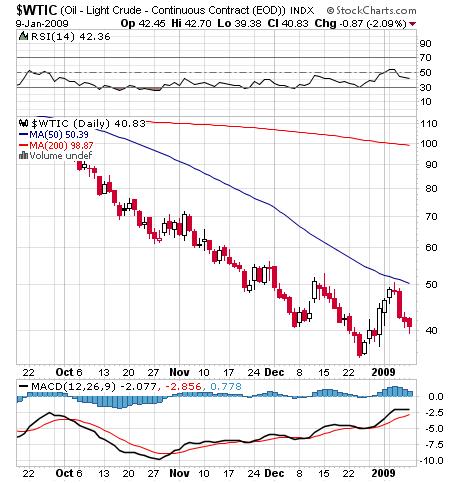
The next chart looks at a market that is one of the purest ways to identify risk.

We are looking at the daily Light Crude chart here. Oil will probably be one of the easiest ways to identify when risk reenters the market. I'm here to use it as just that.
Oil just doesn't seem to be quite ready to move higher. You can see how it just about kissed the 50 day MA before turning around. Oil has yet to stop making lower lows and has formed a formidable double top at the 50 level. The 50 level also happens to coincide with the 50 day MA, making any tests at breaking resistance here even more difficult.
Long term outlook is a different story. In the past 6 months, oil's range is from 145-35. So as far as risk-reward scenarios go, you have to like the long side here. Add that to the reflation story and it seems like a place worth committing some capital.
For the sake of this article, it doesn't matter. When oil rallies through resistance at 50, and starts to form a base above its 50 day MA, that will signify risk returning to the market.
Conclusion
So I'm not exactly calling a bottom, but I'm telling you when I can. Look for the 10-year Treasury Note to break below and hold below its 50 day MA and look for oil to break above and hold above its 50 day MA. Although we aren't there yet, I believe this point to be in the not so distant future
Please note that this article focuses on risk and asset prices as a whole. Besides a brief reference to oil, I didn't focus on the specifics of any markets. That's because I believe this to have a "rising tide lifts all boats" type of rally.
Look for a bear market rally of around 40% in domestic equities. I look for gold to lag other commodities early, but have a strong surge late. The last thing I wanted to say is that when these markets move, it will most likely be fast and violent. The pundits will be quick to jump on board, especially with the rally in stocks. Be aware of this, as it will present opportunity.
By Nicholas Jones
Analyst, Oxbury Research
Nick has spent several years researching and preparing for the ripsaws in today's commodities markets. Through independent research on commodities markets and free-market macroeconomics, he brings a worldy understanding to all who participate in this particular financial climate.
Oxbury Research originally formed as an underground investment club, Oxbury Publishing is comprised of a wide variety of Wall Street professionals - from equity analysts to futures floor traders – all independent thinkers and all capital market veterans.
© 2009 Copyright Nicholas Jones / Oxbury Research - All Rights Reserved
Disclaimer: The above is a matter of opinion provided for general information purposes only and is not intended as investment advice. Information and analysis above are derived from sources and utilising methods believed to be reliable, but we cannot accept responsibility for any losses you may incur as a result of this analysis. Individuals should consult with their personal financial advisors.
Oxbury Research Archive |
© 2005-2022 http://www.MarketOracle.co.uk - The Market Oracle is a FREE Daily Financial Markets Analysis & Forecasting online publication.


