


Stock and Financial Markets Outlook for 2009
Stock-Markets / Investing 2009 Jan 10, 2009 - 01:02 PM GMTBy: Joseph_Dancy

 The S&P 500 index of some of the largest and most profitable companies in the world was down 38.5% in 2008 – the worst performance since the Great Depression. Illiquid market sectors performed worse. Over the last ten years a long term investor in the S&P 500 would have lost money – so much for the ‘buy and hold well known companies' theory of investing.
Liquidity Shock The discrepancy between the performance of the large cap index and the quality of the firms in that index can be explained by a study of stock performance and overall market liquidity conducted by professors Lubos Pastor of the University of Chicago and Robert Stambaugh of the Wharton School of the University of Pennsylvania.
They found that the value of some assets plummet in value during so called ‘liquidity shocks' - events like the 1987 market crash, the Long Term Capital Management crisis, or the current credit crisis. Liquidity shrinks sharply during these events - not just for individual companies but for the markets as a whole.
In the wake of liquidity shocks the professors found some stocks plummet while others barely budge. Historical data indicates small companies are much more susceptible to liquidity shocks than the larger companies that might be found in the S&P 500 index – therefore small cap stocks are much more likely to plummet in value regardless of a company's fundamentals or business outlook, although large cap firms did well on the ‘plunging' aspect in 2008.
Mark Hulbert in a recent column noted that no two market events are identical, but there are numerous precedents for the credit crisis we have seen over the last year. Current economic conditions reflect a global ‘liquidity shock' as severe as has been seen since the Great Depression. Market and economic forecasts for the most part failed to predict the extent of the credit shock, so this event was not easily avoided by investors.
Historical market data indicates that liquidity varies over time, both for the markets and for individual stocks. Professor Lasse Pederson, a finance professor at New York University, has also conducted studies on the market's reaction to liquidity crisis. Pederson notes that ‘securities with high liquidity risk have done very poorly' in the current market. Some of the sectors most susceptible to liquidity shock have in his words ‘gotten killed.'
Liquidity issues impact both the banking sector and the equity markets. The two forms of liquidity are linked and can reinforce each other. Liquidity ‘spirals' can occur where poor funding leads to less trading, reducing market liquidity, increasing margins and tightening risk management, thus further worsening funding, and so on.
Modern Finance & Banking The complexity of the modern capital markets is also magnifying the credit problems. According to Richard Bookstaber, author of A Demon of our Own Design: Markets, Hedge Funds, and the Perils of Financial Innovation “liquidity is the lifeblood of derivatives; unlike the underlying securities derivatives are created on the assumption that they can be hedged on an ongoing basis, and so make continuous demand on liquidity. Without liquidity derivative markets die.”
In light of the freeze-up of the derivative markets it is no surprise that dozens of hedge funds have suspended or limited investor redemptions. Valuing illiquid derivatives in hedge fund portfolios that are rarely if ever traded, using financial models, is almost impossible in the current credit crunch. Financial institutions who may extend margin loans are unlikely to value this ‘collateral' highly. Any liquid asset, including stocks, will be sold to raise cash levels or reduce leverage in this environment.
Add to the mix of liquidity issues the concept of securitization, a key mechanism of modern banking that enables banks to bundle loans and bonds into securities for sale to investors. Securitization, which works like a secondary banking system, has radically changed banking and the credit markets in recent years.
Three decades ago, banks supplied $3 out of every $4 of credit worldwide. Today, because of securitization, that share has dropped to about $1 in $3. The securitization market is moribund now and many of the securities created in this manner have plunged in value – adding uncertainty and risk to the equation.
Some conclude that unless financial institutions can securitize debt — which, in turn, depends on investors' willingness to buy the bundled loans — credit will remain tight even if banks resume lending.
Which in turn would mean liquidity issues could continue to haunt the equity markets and economy.
Liquidity Premium & Excess Returns The positive news is the academic studies found that when liquidity shocks occur they are so intense the securities most vulnerable to these shocks provide substantially higher longer-term returns. This happens, Professor Pastor notes, because these securities must compensate investors for the volatility and risk of big losses during those shocks.
From the beginning of 1966 to the end of 1999 professors Pastor and Stambaugh found the most vulnerable stocks outperformed the most liquid ones by an annual average of anywhere from 7.5 to 9 percent. These returns will be volatile, reflecting the liquidity constraints of the securities. The excess returns are a function of the liquidity of the individual stocks, with the smallest stocks (microcaps) usually having the largest liquidity issues. Illiquidity explains market inefficiencies in a world where universal access to information should make markets efficient.
Professor Pederson's studies of the liquidity premium found that liquidity is highly correlated with company size. The smaller the company in general the less liquid it will be. They also found that in general stocks get more illiquid as the market declines. The difference in returns between the most liquid stocks in their database and the least liquid was roughly 0.6% per month – with the least liquid stocks outperforming.
Because of the liquidity restraints most actively managed portfolio managers avoid establishing positions in small and microcap stocks. While these managers avoid the liquidity shock problem, once a liquidity crisis passes the less liquid market sectors tend to outperform the market in general according to the studies.
The excess returns in the illiquid sectors should, over the longer term, provide high enough returns to make the risk of a credit crisis worth taking according to Professor Pastor. Financial columnist Mark Hulbert concludes that “without a willingness to hold such [illiquid] stocks through liquidity shocks, during which there will be huge short-term casualties, investors will not be able to realize the stocks' long-term potential.”
Liquidity Indicators Professor Pastor notes that it is difficult if not impossible to forecast a credit crunch, otherwise central bankers would successfully combat these periods of market instability. None-the-less some measures of the health of the credit market exist. If the liquidity in the credit markets improves history tells us that the liquidity in the equity markets also improves.
TED Spread
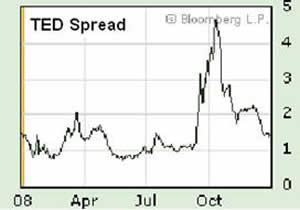 One of the favorite indicators used by economic strategist Donald Coxe is the ‘TED spread' – the yield differential between the front-month 90-day T-Bill and Eurodollar contracts. According to Coxe the TED spread is a real money gauge that measures the risk within the global banking system.
Eurodollars are the primary instrument of inter-bank lending—unregulated and uninsured dollars he explains. When the banking or credit markets are stressed money flows into T-Bills while Eurodollar funds become more expensive, hence the divergence or spread in rates.
The Eurodollar spread over T-Bills reflects bankers' real time pricing of the risk in short-term loans to each other. Coxe claims the TED spread always spikes in advance of a financial crisis, and it always falls when the crisis is past. TED spread readings in October were the highest in 25 years.
It has become even more sensitive over the years as the banking system has become more globalized and network-driven. Serious banking problems anywhere in the system can be enough to produce a flicker—or worse. The chart of the TED spread indicates where we have been, and hopefully where we are going from a credit and investment standpoint.
Coxe claims that once the TED spread falls to below 1.5 the credit crisis will no longer be center stage – while still with us it will no longer assume crisis dimensions. He has tracked this indicator for 37 years and claims it has been accurate. When the measure drops it will be one sign that it may be a time to begin buying stocks in his estimation. The TED spread closed the year at 1.35 and is trending downward, a positive sign.
Monetary Base Richard Russell of the Dow Theory Letter notes that the monetary base is expanding rapidly, which should add liquidity to the markets and to the economy. His comments, made in late December, are as follows:
From another standpoint, the monetary base is now exploding and the Fed has opened the spigots wide. The monetary base is the area from which all the money creation starts. I'm going to quote from my friend Adrian Van Eck, my monetary expert:
 " I have been following moves by the Fed for a lot of years, and I have never, never seen anything like this. The Fed from what we hear, has recently created and injected -- or guaranteed- 7.2 trillion worth of loans, debts and investments...... Chairman Bernanke has made it plain he will do whatever it takes to bring the housing market and the rest of the economy back to health, and later on he will worry about inflation."
VIX Index The VIX is a volatility index, not a measure of actual credit risk. It measures the price range of options on the S&P index. When it leaps upward it generally ‘spells trouble for the market' according to Coxe, and is a measure of investor fear. Declines indicate a more favorable investing environment.
The VIX index peaked on November 20th at 80.86 – the highest reading in over two decades - and has since declined to 40.01. A one-year chart of the VIX at right illustrates the current downward trend of the index, which is a positive sign for stocks.
Key Interest Rates One broad leading indicator of liquidity is the trend of the Federal Funds and related interest rates. As central bankers attempt to inject liquidity into the market interest rates will trend downward (chart courtesy of Hays Advisory).
The Federal Reserve opened a new era in December by cutting its target Fed funds interest rate to as low as zero for the first time in its 95-year history, and signaled it would buy unlimited amounts of securities to add liquidity to the markets.
As can be seen in the chart from Hays Advisory interest rates have been trending downward for well over a year now as the Fed attempts to re-liquefy the credit markets.
High Quality Corporate Bond Yields A related story to the chart above, yields on high quality bonds reflect the stress in the credit markets that became evident last September. The two-year chart below from Hays Advisory indicates that some of the stress on those markets is beginning to dissipate as reflected in the lower yields, which is positive for the economy and stock market.
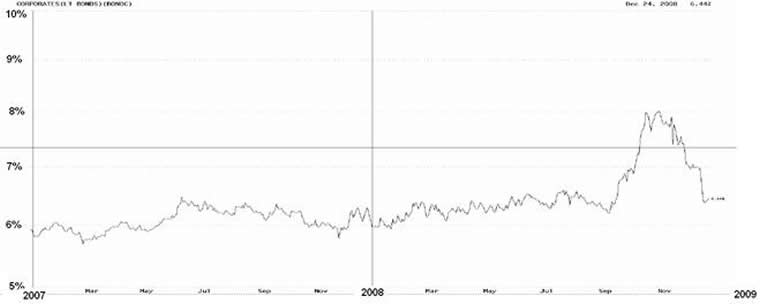
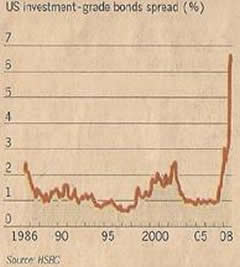 All is not well in the U.S. investment-grade bond market however, as is illustrated by the Financial Times chart at right. It indicates that investment grade bonds sell at a massive premium to less risky Treasury debt.
According to the Financial Times the mid-December spread implies a cumulative default rate on these investment grade issues in excess of 30% - a ‘wild anomaly' that would exceed the 20% default rates on all grades of paper during the Great Depression.
The article concludes that with all the central bank actions to restore liquidity to the markets ‘these yields look aberrant.' We expect they will begin to correct soon. None-the-less, as a measure of liquidity the chart remains a concern for investors.
Deflationary Measures: TIPs and CPI As forced real estate sales continue and business conditions deteriorate the financial markets have signaled a concern that a deflationary spiral may develop in the U.S. as heavily indebted parties are forced to liquidate collateral to meet their financial obligations.
Deflation increases the cost of debt and generally is a sign of illiquidity of the credit markets. When assets are depreciating the value of collateral becomes suspect, creating more illiquidity. Rapid deflation is not an environment in which we generally see robust economic growth or a healthy stock market.
The chart at right of the spread on Treasury issued inflation protected securities (TIPs) from Hays Advisory clearly illustrates those deflationary concerns.
 Early in the month of December the TIPs spread indicated investor expectations for inflation were negative – which means investors expected a deflationary environment. But by late December the TIP spread had recovered and indicated no long term inflationary or deflationary expectations – a positive development. The fact that inflationary expectations are limited also gives the central bankers more alternatives to increase liquidity in the economy.
Prior to the current credit crisis the TIPs spread priced in a roughly 2% annual inflation expectation (see chart). This improvement in deflationary expectations most likely is a reflection of the aggressive Fed, central banks, and political actions being taken to improve the liquidity in the global credit markets.
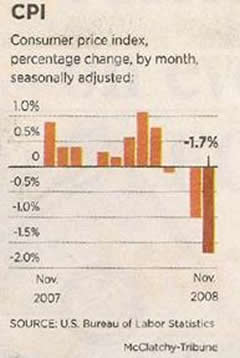
Another measure of inflationary or deflationary trends, the consumer price index, saw its largest drop in history in November. It declined 1.7%, a decline that had not been exceeded in the 60 years the index has been calculated. The lack of liquidity in the economy is fueling concerns that deflation may gain a foothold as reflected by the CPI.
Keep in mind that the consumer price index is a lagging indicator of price trends, and has been heavily influenced by the rapid decline in energy prices. While not a direct measure of liquidity, both the CPI and TIPs markets give us an indication of trends in liquidity.
Risks & Outlook for 2009 In the year just ended we witnessed one of the largest regulatory failures of all time with the failure of numerous financial institutions. The financial system experienced what could be described as the first global run on the banking system in 70 years. As a result global stock markets lost about half of their value in 2008, or $30.1 trillion. In the U.S., $7.2 trillion of shareholder value was lost.
Confidence in the global financial system, banking and securitization, will remain weak until economies stabilize and the applicable political and regulatory authorities regain credibility. The loss of jobs in the U.S. during the recession will most likely be the largest since World War II while the global economy most likely declined for the first time since 1947.
Foreclosures in the U.S. set records in 2008 with house prices still declining in most markets. Sales of houses declined to levels not seen in a decade, with problem mortgage loans rising to record levels. Many of these houses have been financed using alternative real estate financial instruments. Substantial increases in payments may be required in the coming year under the terms of the alternative financing.
Last year the FDIC closed 25 financial institutions in the U.S. According to published reports another 170 troubled institutions remain a concern for regulators. The value of collateral, many times consisting of real estate, does not provide protection to creditors as it declines in value with the slumping economy.
The fact that the majority of personal wealth is held in the form of houses or stock portfolios mean most Americans have seen a substantial decline in their net worth over the last year.
Until confidence in the financial system can be restored by the global central bankers and regulators the liquidity issue will most likely remain one for the markets. The liquidity indicators suggest that credit markets are beginning to heal, but due to the extent of the damage it will some take some time for recovery. Due to the recent level of defaults the global securitization market may be more difficult to repair than the banking sector, which could substantially slow or postpone any economic or market recovery.
None-the-less, the Federal Reserve has made it clear in statements and policy actions it will move to restore credit markets to what should resemble ‘normal' conditions in 2009. On these Fed actions we base our cautiously optimistic viewpoint for the markets in the coming year.
Market Indicators Remain Positive
Last year we expected the market for small cap stocks to perform well. We based our opinion on the premise that historical data shows that when the Federal Reserve is lowering interest rates and easing monetary conditions the markets tend to perform well. The Fed began to lower interest rates over a year ago (see interest rate chart above) so the old adage “don't fight the Fed” applied.
In an environment of easing monetary conditions historically small cap stocks have generally outperformed larger company stocks. Much of the ‘small cap' effect – the excess returns from this sector – are generated during the easing cycle. The easing and added liquidity allows investors to capture the ‘illiquidity premium' in the small cap sector discussed above.
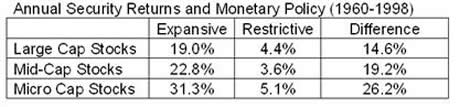 According to a recent study during periods of monetary easing micro cap firms performed 26.2% better than during a restrictive monetary policy environment. The study examined data from 1960 to 1998 (see chart at right).
The micro cap firms averaged an annual return of 31.3% during these easing periods, outperforming large cap stocks in periods of monetary expansion by 12.3% per year and mid-cap stocks by 8.5% per year.
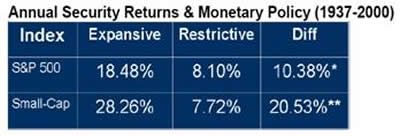 Robert Johnson of the CFA Institute also conducted a study and found that when monetary policy is expansive, as it is now, the small cap sector performs well. His study was conducted over the 1937 to 2000 time period and the results are set out in the chart at right. 2
The mistake we made, and the mistake the central bankers made, was underestimating the extent of the global credit crunch and the impact it would have on the economy and equity markets. The negative feedback loop of collateral prices falling, banks restricting lending, and prices in turn falling further made the business cycle much more volatile than expected. The credit crunch was as severe as any seen since the Great Depression according to some analysts.
The size and scope of the securitization market, an area not directly regulated by the banking regulators and a minor factor in previous recessions, and the subsequent freeze-up of credit in this market was also much more severe than expected. The securitization credit market is larger than the banking system's in the global economy, so problems in this sector have a direct and substantial impact on the global economy. How the central bankers and regulators address the problems will be critical to the economy and markets in 2009.
Assuming the credit crunch in both the banking and securitization issues are addressed successfully the indicators for the market remain positive for 2009:
Value Line Price Appreciation Potential Value Line Inc. analysts calculate a 3-5 year target price range for each stock in their 1700 stock database. This is the estimate of where the price is likely to fall three to five years hence.
If we take this median Value Line appreciation potential number and convert it into a 5 year annualized number, then subtract the current rate of inflation, we can estimate the real annualized appreciation potential figure for these stocks and the overall market.
The current annual Value Line appreciation potential is 16.9% per year – one of the highest appreciation potentials in the last forty years (chart from 1968 to present, courtesy of Hays Advisory).
 January ‘Small Cap' Effect Last month Barron's last month highlighted a study of historical data of how a January investment in small cap stocks performed following a ‘real bad' year in the market. With the S&P 500 index declining 38.5% last year it qualifies as a 'real bad' year.
Examining each year back to 1927 and taking the ten worst years for stock performance, then examining how small caps (defined as the bottom 20% by market cap) performed in January, you would find an astonishing average small cap monthly performance of 18.17% with the worst year (2003) being a positive 2.2% (study by Mebane Faber of Cambrian Investments).
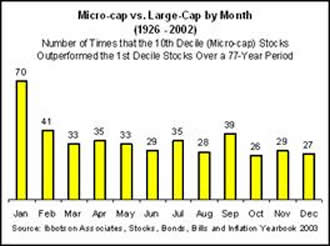
Another study by Ibbotson Associates of the number of times the micro-cap sector outperformed larger cap stocks during January is illustrated in the chart at right (courtesy Chicago Board Options Exchange website). The CBOE chart indicates small companies outperformed in January roughly 90% of the time during the 76 year period (1926 to 2002).
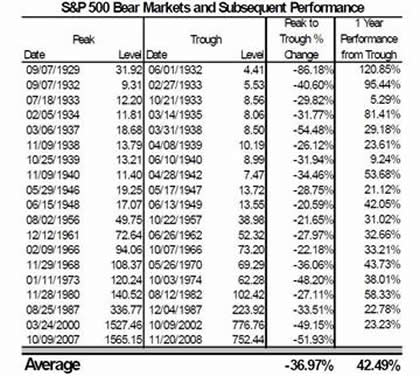 Bear Market Subsequent Performance A recent Citigroup study included the following chart of market performance after bear markets. Keep in mind this is a chart of the S&P 500 index – these are very large and liquid companies compared to what we invest in at LSGI.
Smaller firms historically have performed better than the S&P 500 index coming out of bear markets due to the liquidity effect. Also keep in mind it is impossible to forecast a peak or trough in the market prospectively. None-the-less we found the chart of interest.
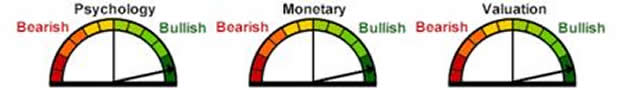
Hays Advisory Asset Allocation Model . Hays Advisory publishes a 30 year old model they developed which analyzes the market's potential.
Since early October all three Hays Advisory indicators – monetary, psychology, and valuation metrics – have been at their maximum bullish levels (see indicators below). For investors with a long term growth objective, based on these indicators Hays recommends a 100% fully invested position in common stocks. Having all three indicators pegged on ‘bullish' is a rare event.
Financial Times: ‘Mass Exit From Mutual Funds' Most actively managed mutual funds had a very disappointing year in 2008 to say the lease. Unfortunately the damage to the equities markets was not limited just to the small and micro-cap firms, or to the U.S. equities markets.
![]()
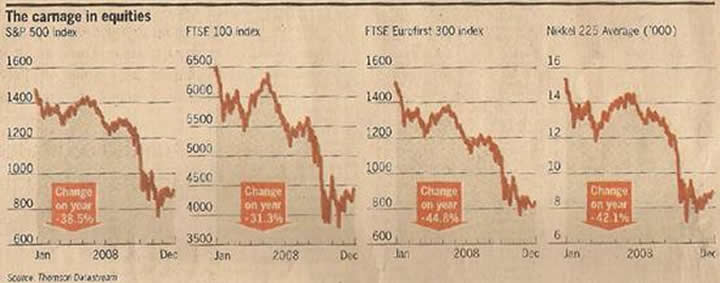
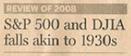 The Financial Times headlined that 2008 marked a ‘mass exit from mutual funds' and featured the following headline and charts of major stock indexes - U.S. (down 38.5%), U.K. (down 31.3%), European (down 44.8%), and Japanese (down 42.1%). It illustrates what a disappointing year it was for investors across the globe:

In one of the biggest flights to safety in the industry's history, public mutual funds recorded a net $320 billion outflow in 2008 as redemptions spiked near year end – easily a record level of redemptions. Dozen of lightly regulated hedge funds also restricted or prohibited redemptions as requests jumped. Even so, hedge fund industry data indicates record investor withdrawals from these investment vehicles in 2008.
Studies indicate redemptions substantially reduce the returns of actively managed portfolios as managers are forced to liquidate holdings at whatever price is offered to meet liquidity requirements. The extent of forced liquidation in 2008 from redemptions and credit issues likely had an impact on stock pricing, especially among companies in the less liquid sectors.
The positive news is that in December investors actually reversed course and invested a net $23 billion into stock mutual funds – a move that should help stabilize the markets. Another positive is that money market funds have posted massive inflows in 2008 and assets held in those funds are now at record levels. These money market funds have very meager returns and represent a massive amount of buying power should investors decide to return to the equities market in 2009.
If the global credit market and market liquidity improves – and we expect they slowly will as central bankers address the problem globally, 2009 should treat investors much better.
Resources:
1. See: Gerald R. Jensen, Robert R. Johnson, and Jeffrey M. Mercer, authors of “ The Role of Monetary Policy in Investment Management”
2. Chart and study courtesy of Hays Advisory
By Joseph Dancy,
Adjunct Professor: Oil & Gas Law, SMU School of Law
Advisor, LSGI Market Letter
Email: jdancy@REMOVEsmu.edu
Copyright © 2009 Joseph Dancy - All Rights Reserved
Joseph R. Dancy, is manager of the LSGI Technology Venture Fund LP, a private mutual fund for SEC accredited investors formed to focus on the most inefficient part of the equity market. The goal of the LSGI Fund is to utilize applied financial theory to substantially outperform all the major market indexes over time.
He is a Trustee on the Michigan Tech Foundation, and is on the Finance Committee which oversees the management of that institutions endowment funds. He is also employed as an Adjunct Professor of Law by Southern Methodist University School of Law in Dallas, Texas, teaching Oil & Gas Law, Oil & Gas Environmental Law, and Environmental Law, and coaches ice hockey in the Junior Dallas Stars organization.
He has a B.S. in Metallurgical Engineering from Michigan Technological University, a MBA from the University of Michigan, and a J.D. from Oklahoma City University School of Law. Oklahoma City University named him and his wife as Distinguished Alumni.
Joseph Dancy Archive |
© 2005-2022 http://www.MarketOracle.co.uk - The Market Oracle is a FREE Daily Financial Markets Analysis & Forecasting online publication.