Stock Market Crash Count Wave Four Triangle
Stock-Markets / Financial Crash Jan 09, 2009 - 05:26 PM GMTBy: Mike_Shedlock

 The S&P 500 is in a wave 4. Please see S&P 500 Crash Count if you are new to this discussion. It is the very nature of waves 4's to morph, and morph it has. Over the past month the preferred count has changed at least 3 times. If you chose to play waves 4's it is best to be nimble.
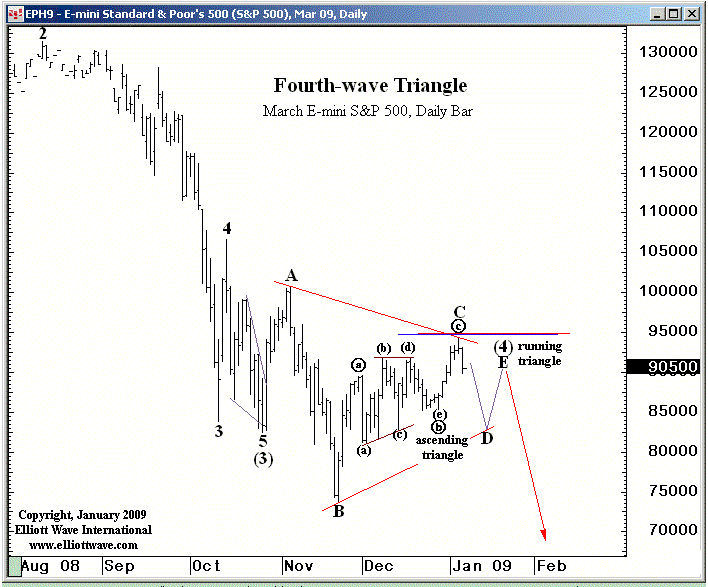
Here is yet another interpretation of where we are.

Chart above is courtesy of Elliott Wave International and Steve Hochberg's Financial Forecast Short Term Update . Reprinted with permission.
There are also a number of other valid potential counts that Hochberg and other practioners have outlined. However, what is clear in all of the likely E-Wave counts is that the move up from the November low is a correction. More importantly the move has already satisfied the minimum expected price and time targets for some of the potential counts.
Given that the market looks like it want to move lower here, it is important to focus on the next downside move at this point. There is always the potential for another swing up in any correction, but time appears to be running out on that idea.
If the above count proves to be the correct count, it would imply that a wave 5 decline is on its way below the November low. Whether or not that is the correct count, it is a valid count that commands respect.
We had a target of 1000 on the S&P and although that could still happen, two days ago we abandoned the idea based on a variety of data, not any explicit wave count per se.
We did not like the volume on the move up, various oscillators, the length of time it was taking to retrace and numerous other confirming factors all of which suggested 1000 was not going to happen.
In non-Ewave terms please consider this chart of DOW.
$INDU Dow Jones Industrial Average

Since reaching a low in October on almost all daily based technical indicators, we have now reached an overbought position - but price has gone almost nowhere since then. This is typically a very bearish sign.
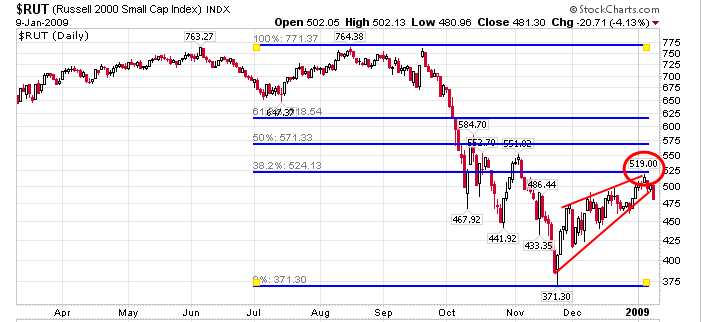
$RUT Russell Daily Chart

We bailed on net long positions mid day when the Russell tagged that 38% retrace target.
The S&P was still 70 points away from its 38% retrace target at roughly 1008, and all of the other indicators we follow were sporting overbought conditions, something to be very wary of in bear markets.
This shows a need to be focused on number of indicators and indices not just one.
Sitka Pacific Hedged Growth Strategy is back to a market neutral strategy as of two days ago, as is Sitka Pacific Absolute Return . This is a defensive position for us. We reserve the right to change out mind, without notice, at any time.
By Mike "Mish" Shedlock
http://globaleconomicanalysis.blogspot.com
Click Here To Scroll Thru My Recent Post List
Mike Shedlock / Mish is a registered investment advisor representative for SitkaPacific Capital Management . Sitka Pacific is an asset management firm whose goal is strong performance and low volatility, regardless of market direction.
Visit Sitka Pacific's Account Management Page to learn more about wealth management and capital preservation strategies of Sitka Pacific.
I do weekly podcasts every Thursday on HoweStreet and a brief 7 minute segment on Saturday on CKNW AM 980 in Vancouver.
When not writing about stocks or the economy I spends a great deal of time on photography and in the garden. I have over 80 magazine and book cover credits. Some of my Wisconsin and gardening images can be seen at MichaelShedlock.com .
© 2009 Mike Shedlock, All Rights Reserved
Mike Shedlock Archive |
© 2005-2022 http://www.MarketOracle.co.uk - The Market Oracle is a FREE Daily Financial Markets Analysis & Forecasting online publication.


