Why Buy Gold 2009?
Commodities / Gold & Silver 2009 Jan 07, 2009 - 11:23 AM GMTBy: Peter_Zihlmann
| Gold/Ounces in US$ | |||||
| Buy Date | Amount | Buy Price | Total (USD) | Price Today | Value Today |
| November 7, 2002 | 100/oz. | 318.90 | 100/oz. | ||
| Total | 100/oz. | 318.90 | 100/oz. | 886.20 | 78'620.00 |
| Profit | 46'730.00 | ||||
| Profit (in %) | 146.53% | ||||
| OUR LONG-TERM RECOMMENDATION | BUY | ||||
| OUR SHORT-TERM RECOMMENDATION | BUY | ||||
1980 to 2009: From bear to bull: the multi-year trends and the long-term picture
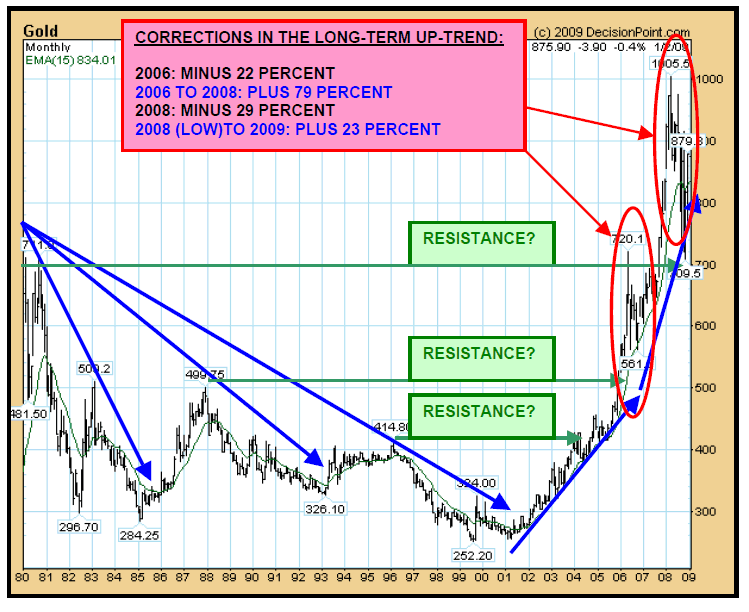
The chart above clearly shows one thing: long-term trends often last many years . The bear market that started in 1988 ended in 1993. The up-swing that followed lasted three years from 1993 until 1996 and culminated in what may be called a false break-out. Then another bear-market unfolded taking the gold price down to $ 250 over a period of almost four years.
Then the spike in the gold price (1999) came as a consequence of the central banks' announcement that they would be limiting their gold-sales.
The 1999 bottom was tested again at the beginning of 2001. At that time, when few believed that any money should be put into precious metals, the present bull market started; a bull market we deem has still a long way to go in spite of the present correction.
In 2006, the gold price reached a fresh recovery high of $ 720.1 after a steep rise of roughly 80%. The correction that followed took it down to $ 560 or 22% before the gold price started to climb again to reach a high of 1005.5 points in January 2008.
This correction that followed resembles the one we had gone through in 2006. The long-term trend is intact and we expect the gold price to reach a new high not later than 2009.
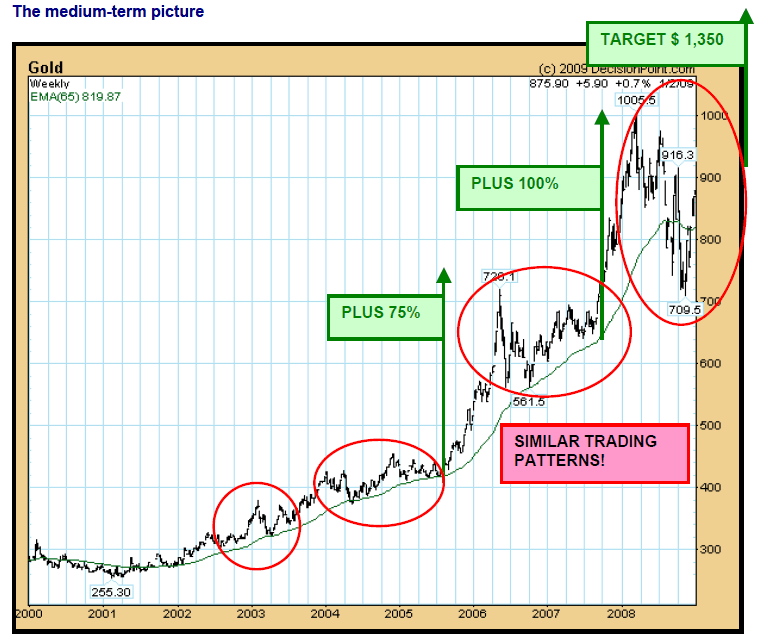
From the above presentation, it is easy to see that there have been many buying opportunities since this bull market started in 2001, along with some excellent prospects for selling. Each time the gold price fell back to or below the EMA 65 (green line) we would have been well advised if we had bought.
While prices have turned around each time they fell to the EMA 65, the situation is a bit different this time as the gold price has fallen below the average and stands at minus 5%. This situation could correct quickly and neutralize the negative impact.
At this junction, it can be helpful to see how gold and silver stocks fared compared to gold:
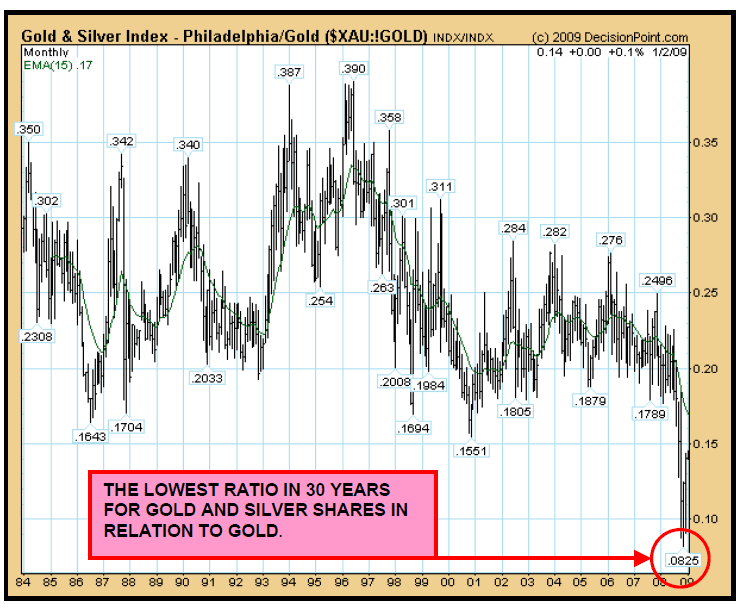
Gold and silver shares have been sold indiscriminately when the present financial crisis erupted. Fundamental aspects have been totally ignored as the need to raise cash was all that was required to sell shares.
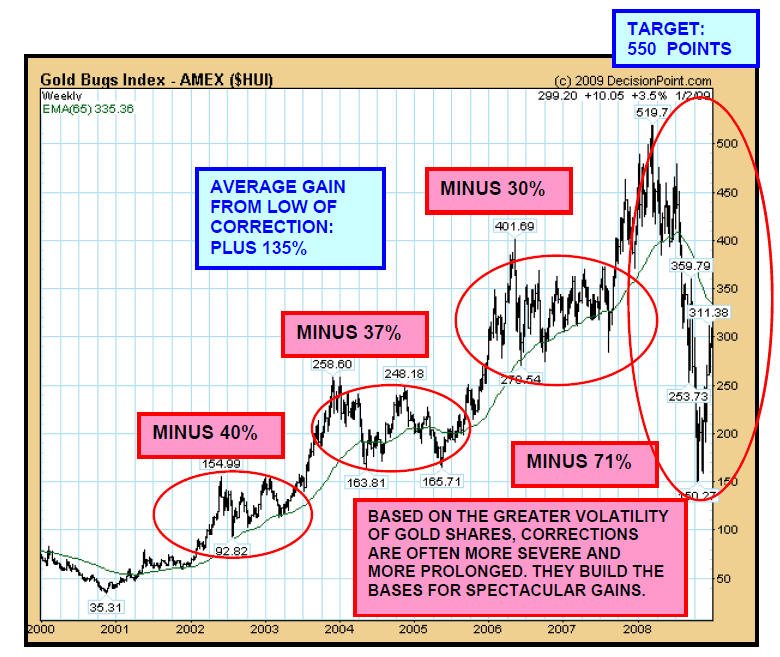
Gold and silver shares have thus fallen to absolute bargain prices which promise outstanding capital gains. However, apart, from the fundamental aspect, also the technical picture is bright as the graph below demonstrates. We have had the 5th buy signal since 2000.
Should you own gold rather than gold shares?
Gold and gold shares do not move in a parallel fashion. At times, gold is leading, at times the gold shares.
We have shown above that gold shares over the long-term show a far better performance than the metal - in fact, since the start of the bull-market, gold shares outperformed the gold at ratio of 5 to 1.
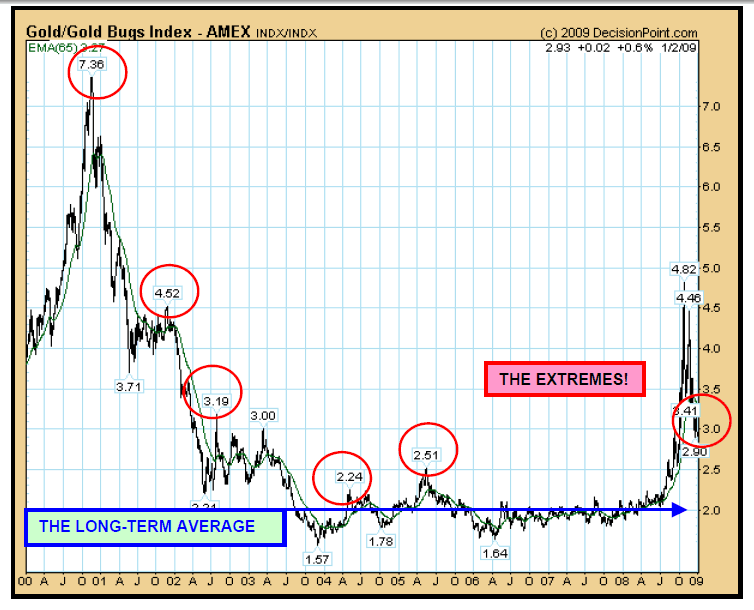
In the short-term, the ratio between the price of gold and the HUI Index does not remain constant as the graph below demonstrates. A ratio of about 2 would be a long-term average but it can go up to reach 2.5 or 3 points or down to 1.5 points. Such extremes would be a signal of buying or selling opportunities.
Where are we now? We stand at 2.9 points. This indicates that the gold shares which are represented in the HUI Index have not kept pace with the gold price since the beginning of 2006. Whether gold or gold shares will outperform in the future has to be seen but as we expect the gold price to move higher, we would not be surprised when gold shares also would move up strongly, outperforming gold because they have fallen to an unrealistic low level based on the outlook for earnings, production or reserves.
Are you frustrated owning gold stocks?
Probably yes!
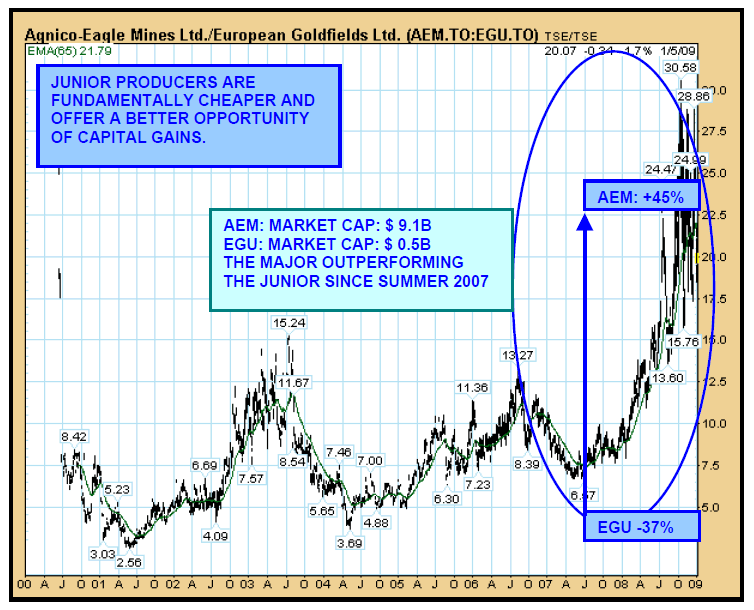
Major gold stocks fared well during the first half of 2008 - until July as shown in the chart below of Agnico-Eagle . AEM traded at $ 82.80 at the beginning of July and corrected down to $ 26.60, a drop of almost 70%.The PE ratio based on 2009 estimated earnings fell from 50 to 15.
Since touching the low point at $ 26.60, the share price jumped more than 100% showing the potential for capital gains for all gold stocks - especially those which are still depressed.
Also junior producers like Alamos Gold showed remarkable recoveries from their lows, increasing more than 100% in value.
Most junior gold stocks trade at depressed values. Our recommended stocks like Gold Resource ( http://www.goldresourcecorp.com/ ) or European Goldfields ( http://www.egoldfields.com/goldfields/ ) should do very well during the coming months.
 The recommendations were valid at the time of writing, viz. at
but may no longer be pertinent at the time of reading.
By Peter Zihlmann
www.pzim.com
invest@pzim
phone +41 44 268 51 10
mobile +41 79 379 51 57
Disclaimer: P. ZIHLMANN INVESTMENT MANAGEMENT AG does not accept any liability for any loss or damage whatsoever, that may directly or indirectly result from any advice, opinion, information, representation or omission, whether negligent or otherwise, contained in the trading recommendations or in any accompanying chart analyses, whether communicated by word, or message, typed or spoken by any of its employees.
Peter Zihlmann Archive |
© 2005-2022 http://www.MarketOracle.co.uk - The Market Oracle is a FREE Daily Financial Markets Analysis & Forecasting online publication.


