


Gold and Crude Oil Trading 2009 Special Report
Commodities / Gold & Silver 2009 Jan 04, 2009 - 06:57 PM GMTBy: Chris_Vermeulen

 Gold Trading: Gold closed higher for the week with very low volume due to the holidays. It is difficult to get a feel for where stocks and commodities are headed in the near term because of this light volume. Generally during holiday season light volume favors the longs and prices generally drift higher, which is what we had last week. The charts below will show you how I see the market and how I react to these salutations.
Gold Stocks – Gold Bugs (HUI) Monthly Chart
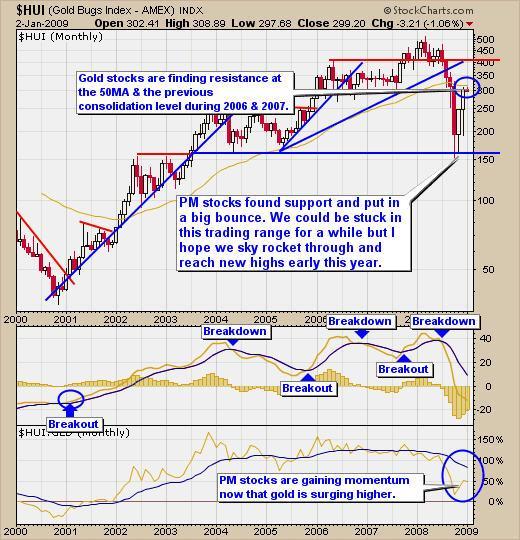
This chart shows us where gold stocks are and where resistance and support can be found. As you can see in the chart below, gold stocks found major support at the 150 level, which was previous support. Prices have bounced higher and are currently at the 50 moving average which generally provides resistance if below, and support if prices are above this moving average. We continue to wait for a setup in our trading model, which does not find the bottoms or tops, but rather captures the high probability moves in the middle, when risk is low and a short term trend has formed. We focus on the daily chart for trading though. Most of the gold equity etf's are showing signs of exhaustion and the monthly chart shows us the reason prices for GDX and other gold stock etf's have been moving sideways.
The Gold Bugs Index (HUI) is a great indicator and I find it leads the price of gold for up to 4 days on the daily chart and up to 2 months on the monthly chart in some situations. The monthly chart of the HUI shows a very clear picture, as to where we stand for gold equities. Again we have had a solid bounce off support, but what we really want to see here is the HUI to continue climbing faster than the price of gold, which will help confirm the bottom for gold prices.
Gold Stocks (HUI) Monthly Chart
Gold Price – Gold GLD Weekly Chart
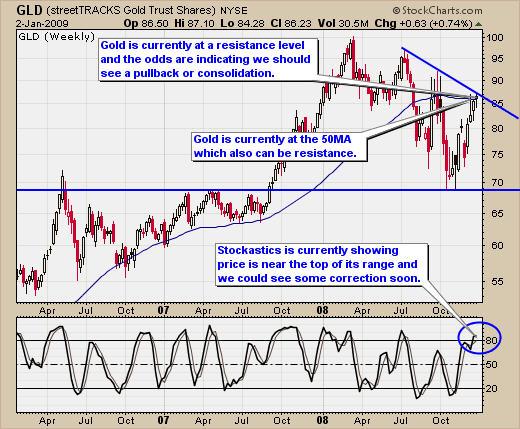
Gold has had a great rally in the past 7 weeks and we have locked in about 15% profit on a small swing trade since our short term buy signal a few weeks ago. This weekly chart helps show us where to find support and resistance for gold which is clearly shown with my trend lines.
As you can see below on the chart, gold is currently at several resistance levels (trend line, 50 moving average, and my custom stochastic). This puts the odds in our favor the prices should consolidate or have some type of correction over the next few weeks.
I get a lot of emails from traders wondering why we are not buying gold at this level and I think this chart shows why. Not to mention we are currently long and took some big profits 2 weeks ago.
Gold GLD Weekly Chart
Gold Stocks – HUI Daily Chart
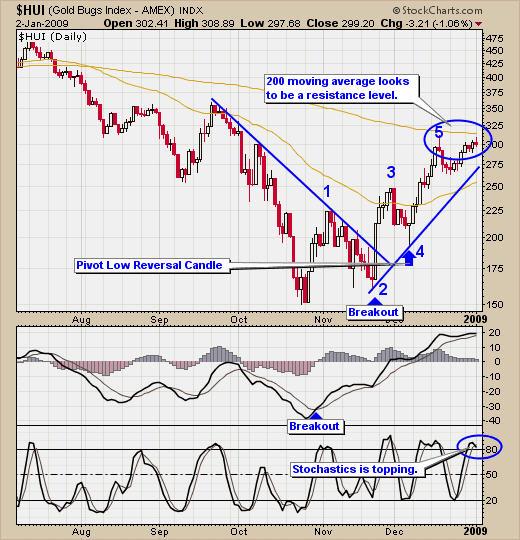
Gold stocks are starting to look like they are topping here. The 200 moving average and stochastic are both indicating a short term top. This is when we could see the price of gold stocks drop before the price of gold actually drops. Only time will tell. It is not wise to buy at resistance therefore we will wait for a low risk setup before putting our hard earned money to work.
HUI Daily Chart
Short Term Gold Prices – GLD Daily Chart
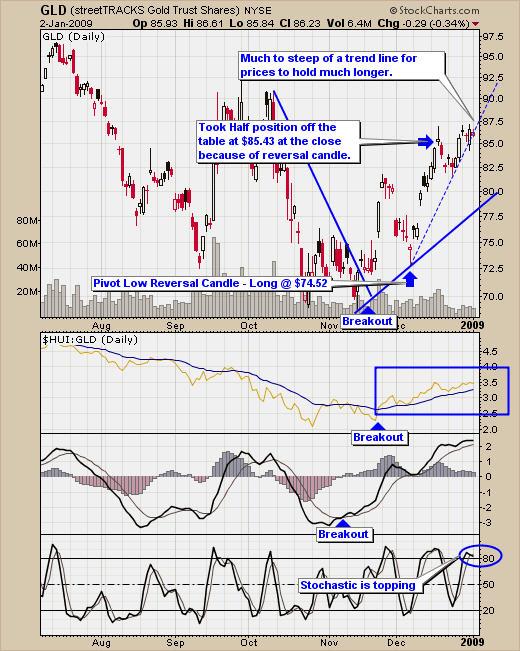
Gold's price action looks to be topping on the daily chart. I think we have seen the bottom in gold but I do think we are going to have some type of consolidation or pullback in the near future. Buying at this level holds a very high level of risk. The key is to wait for a clear cut setup and signal using my trading model then take some profits near cycle tops and add during cycle bottoms/low risk reversal signals.
The chart below shows what I see and why I enter and exit at these levels.
GLD Trading – Daily Chart
Gold Summary:
Spot gold price and gold equities are showing signs of a top. My focus and goal is to buy and sell gold, silver, oil and other exchange traded funds when our risk is less than 3% and we have a big potential gain in price. I don't trade or pick tops or bottoms; I focus on catching the middle section which provides the least amount of risk and lots of potential still. This also gives us lots of time once sectors have changed direction to find an entry point. Risk is measured using my trading strategy, which is available to all members of my site.
The Crude Oil Outlook
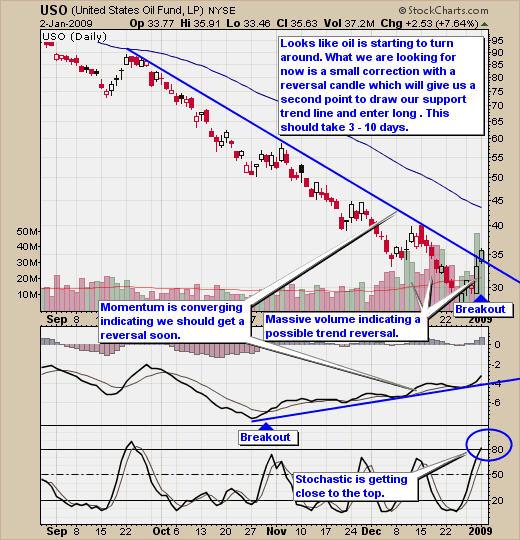
Crude Oil has been under immense selling pressure the past 6 months and we should see some nice returns if we can get a low risk setup. Most traders try to pick tops and bottoms and it's something that I learned a long time ago never works in the long run. Yes oil looks very bullish here but it also looked the same during the previous 4 bounces only to be followed by more selling pressure. Waiting for a low risk setup and signal requires a lot of self discipline because you always think that the price is going to run without you. I feel like this every time I see a reversal taking place but you must fight the urge to chase prices. I do miss trades all the time because they run without me but I also catch a lot and my losing trades are very small which is what makes this so effective.
The chart below shows you how I see the price action of crude oil.
Crude Oil Fund – USO Exchange Trade Fund
Oil Summary:
We continue to wait for the Oil industry to smooth out and provide a solid foundation for a possible trade. Doing anything at this level is simply chasing and generally a losing position.
For more information, questions or to receive my Free Weekly Special Report please visit my website: www.TheGoldAndOilGuy.com
By Chris Vermeulen
Chris@TheGoldAndOilGuy.com
Please visit my website for more information. http://www.TheGoldAndOilGuy.com
Chris Vermeulen is Founder of the popular trading site TheGoldAndOilGuy.com. There he shares his highly successful, low-risk trading method. For 6 years Chris has been a leader in teaching others to skillfully trade in gold, oil, and silver in both bull and bear markets. Subscribers to his service depend on Chris' uniquely consistent investment opportunities that carry exceptionally low risk and high return.
This article is intended solely for information purposes. The opinions are those of the author only. Please conduct further research and consult your financial advisor before making any investment/trading decision. No responsibility can be accepted for losses that may result as a consequence of trading on the basis of this analysis.
Chris Vermeulen Archive |
© 2005-2022 http://www.MarketOracle.co.uk - The Market Oracle is a FREE Daily Financial Markets Analysis & Forecasting online publication.