


Gold Rallying Towards Resistance
Commodities / Gold & Silver 2009 Jan 04, 2009 - 01:02 PM GMTBy: Clive_Maund

 We've been here before haven't we? Gold has been in a rising trend for some considerable time, taking it to trendline or resistance targets, and then "wham!" it gets whacked back down again. Certainly the long-term outlook for gold is excellent, especially given the strong and increasing demand for physical, but over the short to medium-term it now looks set to get taken down again.
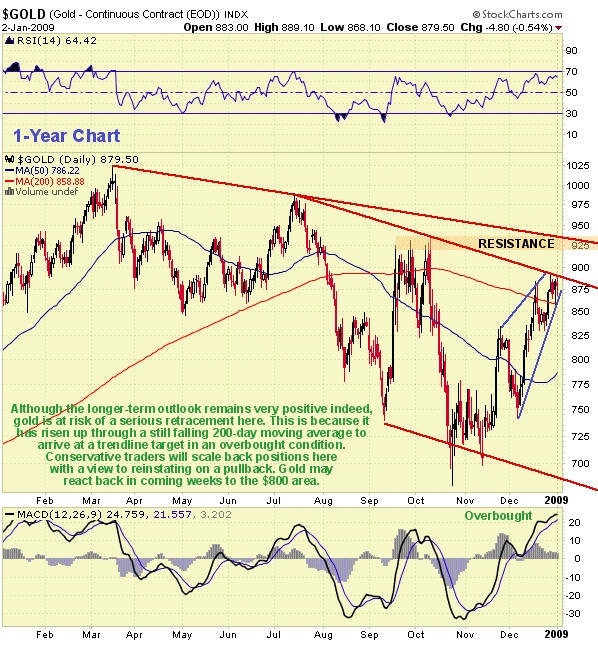
On the 1-year chart we can see that after a very good run which saw it recover some $200 from its October lows gold has arrived at downtrend channel line resistance, having pushed through a still falling 200-day moving average, which remains a bearish influence. Several factors point to a reaction here, which could be quite heavy.
One is that the price has advanced way above the 50-day moving average and although this average has turned up, which is in itself bullish and bodes well over a longer timeframe, it is still way below the falling 200-day, signifying that gold probably needs more time before it can launch a fresh assault on the $1000 barrier. Another development increasing the chances of a reaction is the fact that the advance has been losing vigor, so that a bearish Rising Wedge has appeared on the chart, which is thought likely to result in a breakdown soon. Finally gold is considerably overbought, as is plain from the MACD indicator at the bottom of the chart.
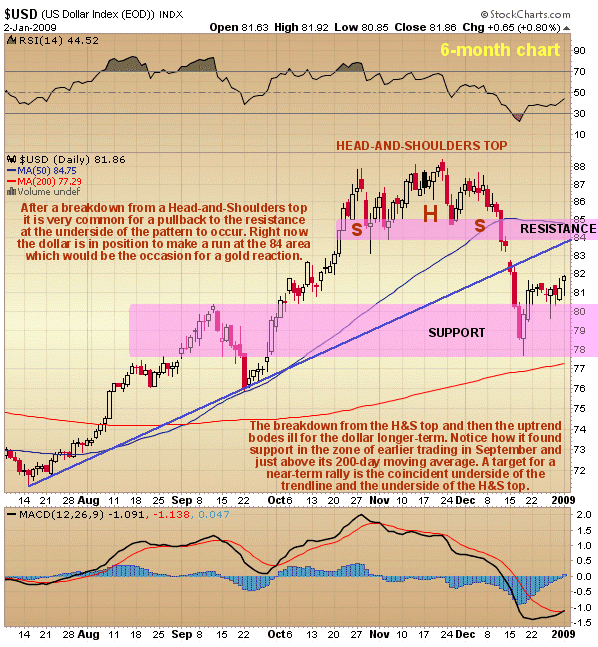
If gold is set to drop then it implies that dollar is about to recover further. The dollar is still thought to have peaked, having broken down from a Head-and-Shoulders top area that formed from mid-October through early December. There is, however, room for a near-term recovery rally back up to the 84 area, and it may even make it to 85, which would of course provide the perfect background for a gold reaction. Pullbacks to the "neckline" are very common after a breakdown from a Head-and-Shoulders top area.
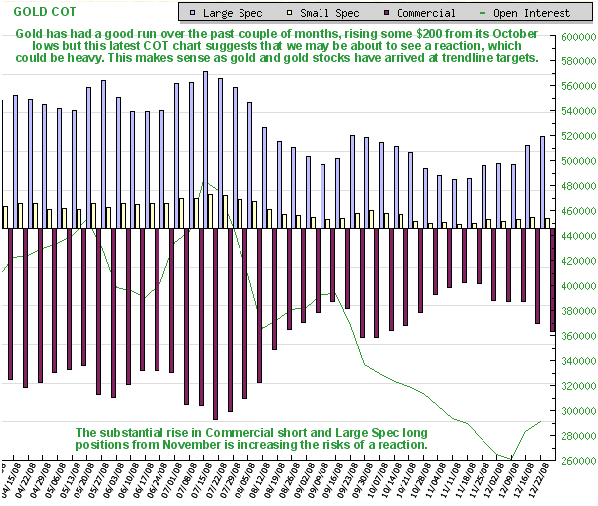
The latest gold COT chart shows that Commercial short positions and Large Spec long positions have continued to climb to levels that are increasing the probability of an imminent reaction.
So thanks, but no thanks, we are content to let others run the risk of finding out whether gold can continue still higher over the short to medium-term. Conservative and big money traders will be booking at least some of the large profits garnered over the past couple of months, and we are content to do the same here. If gold and Precious Metal stocks now react back as expected we will increase positions again for the next upleg.
By Clive Maund
CliveMaund.com
For billing & subscription questions: subscriptions@clivemaund.com
© 2008 Clive Maund - The above represents the opinion and analysis of Mr. Maund, based on data available to him, at the time of writing. Mr. Maunds opinions are his own, and are not a recommendation or an offer to buy or sell securities. No responsibility can be accepted for losses that may result as a consequence of trading on the basis of this analysis.
Mr. Maund is an independent analyst who receives no compensation of any kind from any groups, individuals or corporations mentioned in his reports. As trading and investing in any financial markets may involve serious risk of loss, Mr. Maund recommends that you consult with a qualified investment advisor, one licensed by appropriate regulatory agencies in your legal jurisdiction and do your own due diligence and research when making any kind of a transaction with financial ramifications.
Clive Maund Archive |
© 2005-2022 http://www.MarketOracle.co.uk - The Market Oracle is a FREE Daily Financial Markets Analysis & Forecasting online publication.