


China's Shanghai Index Is Falling "On Schedule" to Effect All Financial Markets
Stock-Markets / Chinese Stock Market Apr 19, 2007 - 10:13 PM GMTBy: Marty_Chenard
 China, Shanghai 180 Update: Yesterday, we warned our paid subscribers with the
following: "Day traders and short term traders should be extra cautious today and tomorrow ." It is
now "tomorrow" ... and this morning, the Shanghai 180 fell 6.93% before a small retracement
that took it to a 4.25% loss for the day.
China, Shanghai 180 Update: Yesterday, we warned our paid subscribers with the
following: "Day traders and short term traders should be extra cautious today and tomorrow ." It is
now "tomorrow" ... and this morning, the Shanghai 180 fell 6.93% before a small retracement
that took it to a 4.25% loss for the day.
If you recall, we posted this expectation last week, warning members that the Bow Tie Pattern
was repeating 100%. The exact, first down day should have been Wednesday, and instead
it was off by one day. In spite of being 1 day late, we warned that the probability of falling
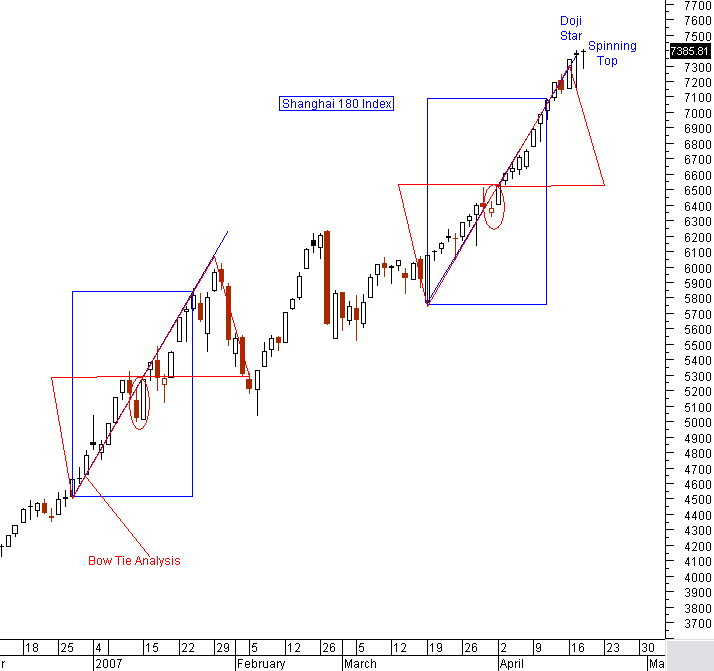
today was extremely high because the Shanghai 180 had a Doji Star on Tuesday, and
a Spinning Top on Wednesday ... both were candlesticks that typically precede a downside
reversal. *** See the chart below, and the previous postings, including last week's analysis and warning.
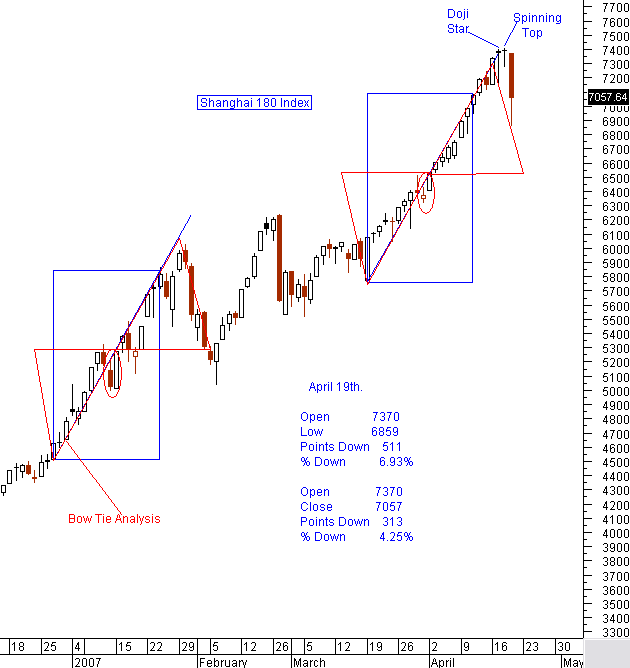
So the Shanghai is repeating the Bow Tie pattern ... what now?
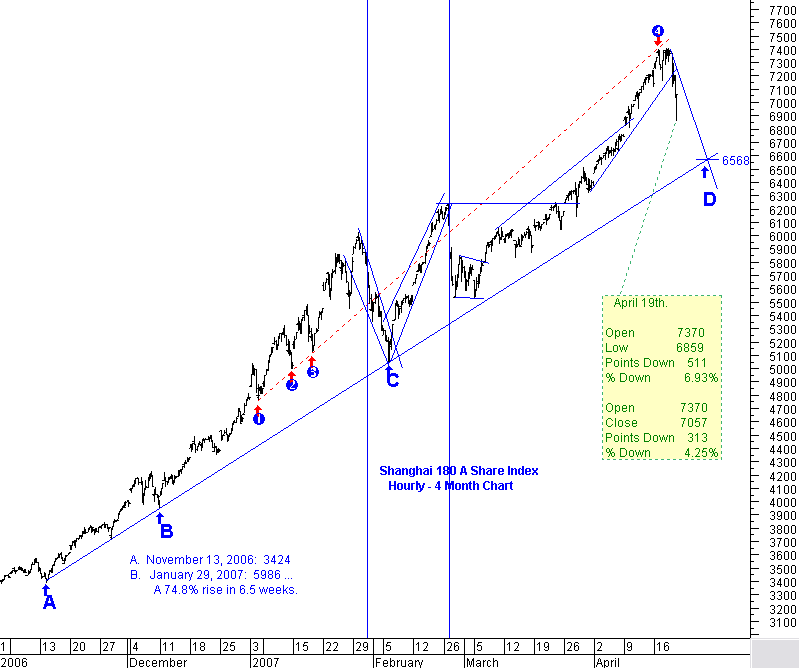
The last Bow Tie Pattern took the Shanghai 180 down to its support at label C below, so I expect that
this drop will move down to the support once again at label D which is 10.88% from the index's open
this morning. That would take the Shanghai down to a support level of 6568.
Could it go lower??? ... see the next chart.
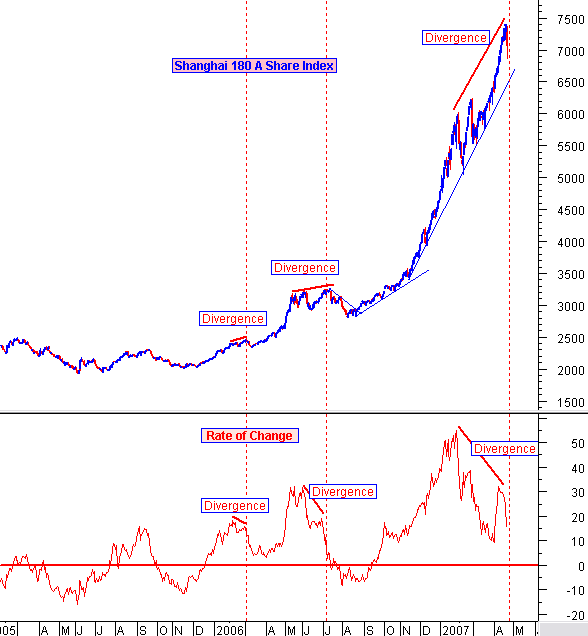
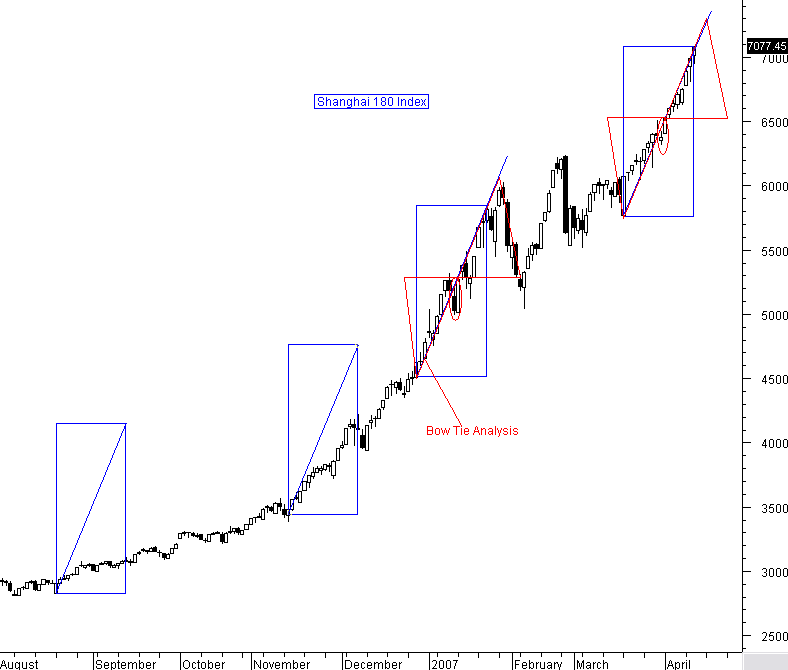
This is the Shanghai 180's two year chart showing its parabolic rise that compares to the
Internet Bubble we had.
The Shanghai 180 may indeed go lower and end up in a crash as I had previously published
on our February 19th. (posted 24th at MO): http://www.marketoracle.co.uk/Article392.html
Here is the updated parabolic Shanghai 180 chart and the divergence warning that it is sending.
While there is a long term support line for 6568, it is now facing another negative divergence
pattern as seen below. Note that the two previous patterns had a divergence drop that
took out the previous 2 and 3 months of up action. Should the current negative divergence
do the same, then the Shanghai could see a 25% drop from yesterday's close.
This is indeed a bubble, as the Shanghai 180 has gone up 264% since January of last year.
That is the equivalent of our DJI moving up from yesterday's 12803 to 33816 in the next five and
a half quarters.
In February, I said that China would have a crash this year ... we are getting closer
to that event.
__________________________________________________________
April 18th. - China, Shanghai 180 Update: The Bow Tie Pattern for the Shanghai is below. Last night was
day 5 for being outside the pattern and we expected the Shanghai to move down in order to replicate the pattern.
It didn't go down. But it had candlestick spinning top ... one of our subscribers called it a Dragonfly Doji.
Doji(s) typically appear at market turning points , and we now have a " double Doji " occurrence. This increases
the odds for the Shanghai moving down tonight.
*** The market pull backs or corrections are now happening on unsuspected negative "events". The Shanghai
would be such an event, so with the current double Doji pattern, we will keep our conservative investors
in cash as this unfolds. Day traders and short term traders should be extra cautious today and tomorrow .
__________________________________________________________
April 17th. Update to Special China Analysis ... (See the full analysis below this update.)
Today is the fourth day after the pattern of the Shanghai 180 breaking out of its rectangle. The last pattern,
in January, had the Shanghai move up four more days after moving out of the right corner of the rectangle and
then reversed down .
The current pattern has been an exact repeat, so far. We are now at the critical point of day
four today. On the previous pattern, the Shanghai 180 went down on the 5th. day after exiting the outside of the rectangle.
Tomorrow (Wednesday) will be day five .
If the pattern repeats, then the Shanghai 180 will trend down tomorrow ... before our markets open.
Last night, the Shanghai closed the day with a Doji Star, or what some would call a Long Legged Star. This is
considered to be a reversal candlestick , but the next day is needed for confirmation ... which will be tomorrow.
It is an interesting coincidence that we have a bearish Doji the day before the Shanghai should move down based on the pattern.
If the pattern repeats, then the Shanghai will move down tomorrow and exert downside pressure on the
international markets. This will indeed be interesting, because there are huge liquidity injections coming
into our market which is an offsetting force to external downside pressures. If there is a big enough drop
on the Shanghai tomorrow, then the markets would consider this an "event" and react negatively.
While we won't know if this patterns repeats 100% until tomorrow, we do know that the repeating factor
for this so far has been an extremely rare and unusual event .
__________________________________________________________
April 11th. China Report and Bow Tie Pattern Analysis ...
__________________________________________________________
Most of you know that I spend at least 15 hours a month on new research or exploring new market patterns.
I found something very unusual going on in the Shanghai Index, unusual enough that I thought it was
important to share it with you ...
Will the Shanghai 180 Index correct within 4 days and take our markets down with it?
This morning, we made a very interesting observation about the Shanghai 180 Index. The Shanghai is an
index that we are watching pretty closely due to its correlation with our Feb. 27th. market drop.
I will show you two Shanghai 180 charts this morning with a very interesting pattern.
The first chart shows the Shanghai from last year to this year. As you know, as an index or market
continues to have a bull rise, the angle of ascent increases. If you look at the first three rectangles,
you can see how the price action moves up at higher angles as the rally moves forward.
Each rectangle is the same size and shape depicting the same time periods. I drew a line from
the lower corner to the upper corner of each rectangle and this gives you equal slopes for each area.
Now ... see the next chart for the fascinating pattern .
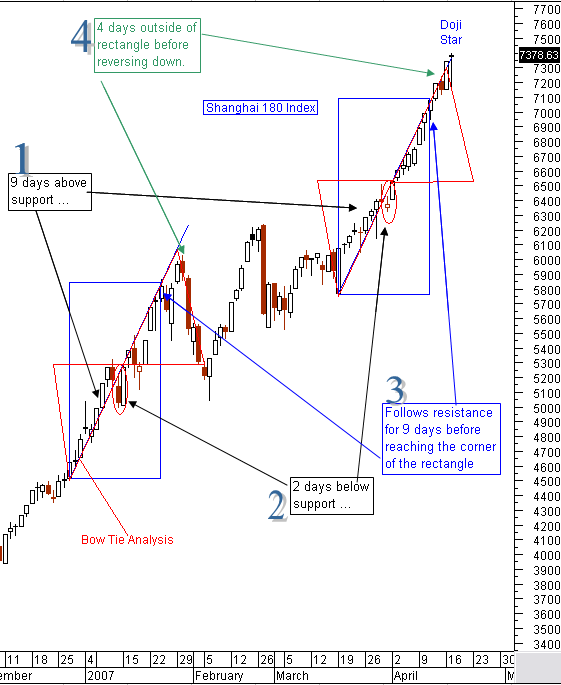
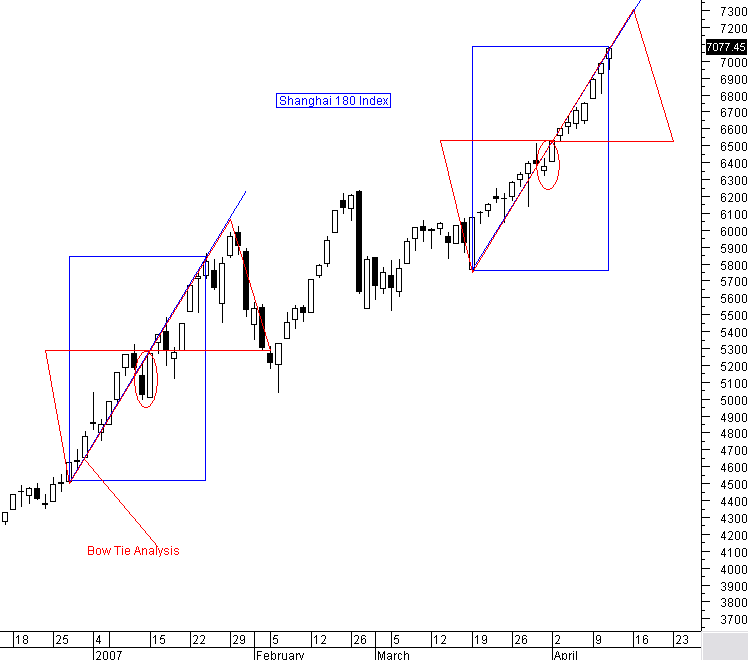
This chart is a close up of the last two rectangles.
Now, for the fascinating pattern ...
I drew a triangle that encompassed the move of the first 9 days that held the trend line on the first rectangle.
I then duplicated the triangle's size 3 more times and overlaid them on the remaining parts of both rectangles.
In the first rectangle , the upper triangle ends above the rectangle's box and marks the exact peak and reversal
of the Shanghai 180. Pretty amazing symmetry.
So in rectangle 1, this is what occurred:
a. The index moved up for 9 days holding its trend line.
b. The index moved on the right side of the trend line and remained below the second triangle for 2 days .
c. It then completed the second 9 day move on the underside of the trend line and reached the upper corner of the rectangle .
d. It then moved up another 4 more days in order to reach the top of the same sized triangle .
e. After reaching that point the Shanghai corrected.
Now let's look at the second rectangle:
a. The index moved up for 9 days holding its trend line.
b. The index moved on the right side of the trend line and remained below the second triangle for 2 days .
c. It then completed the second 9 day move on the underside of the trend line and reached the upper corner of the rectangle .
That's were we are now ... 3 exact pattern repeats so far.
The interesting question is ... Will (d) and (e) also repeat this exact pattern?
If it does, then the Shanghai will make its high in 4 days and then correct again.
The Shanghai January 31st. correction didn't really affect our markets, but the Shanghai February 27th.
correction did. If this pattern repeats, then by the middle of next week, the Shanghai will correct with
a good possibility that it takes our markets with it.
Comments: We don't really know if (d) and (e) will follow the same pattern, and if the Shanghai would
then correct and affect our markets. We do know that this is a very fascinating pattern that is repeating
itself 100% so far. I know that this is some very unusual pattern research, but when my eye can
pick out such a pattern with such unusual repeat factors, then I feel it is my duty to at least share
the observations with you.
By Marty Chenard
http://www.stocktiming.com/
Please Note: We do not issue Buy or Sell timing recommendations on these Free daily update pages . I hope you understand, that in fairness, our Buy/Sell recommendations and advanced market Models are only available to our paid subscribers on a password required basis. Membership information
Marty Chenard is the Author and Teacher of two Seminar Courses on "Advanced Technical Analysis Investing", Mr. Chenard has been investing for over 30 years. In 2001 when the NASDAQ dropped 24.5%, his personal investment performance for the year was a gain of 57.428%. He is an Advanced Stock Market Technical Analyst that has developed his own proprietary analytical tools. As a result, he was out of the market two weeks before the 1987 Crash in the most recent Bear Market he faxed his Members in March 2000 telling them all to SELL. He is an advanced technical analyst and not an investment advisor, nor a securities broker.
© 2005-2022 http://www.MarketOracle.co.uk - The Market Oracle is a FREE Daily Financial Markets Analysis & Forecasting online publication.