U.S. CPI Inflation Turning Negative, Deflation?
Economics / Inflation Jan 02, 2009 - 04:59 AM GMTBy: Mike_Shedlock

 " Owners' Equivalent Rent " (OER) is the largest component in the government measure of the Consumer Price Index (CPI). OER is a process in which the BEA estimates what it would cost if owners were to rent the homes they own from themselves. I do not believe this to be a valid pricing barometer.
By ignoring housing prices, CPI massively understated inflation for years. The CPI is massively overstating inflation now.
By ignoring housing prices, CPI massively understated inflation for years. The CPI is massively overstating inflation now.
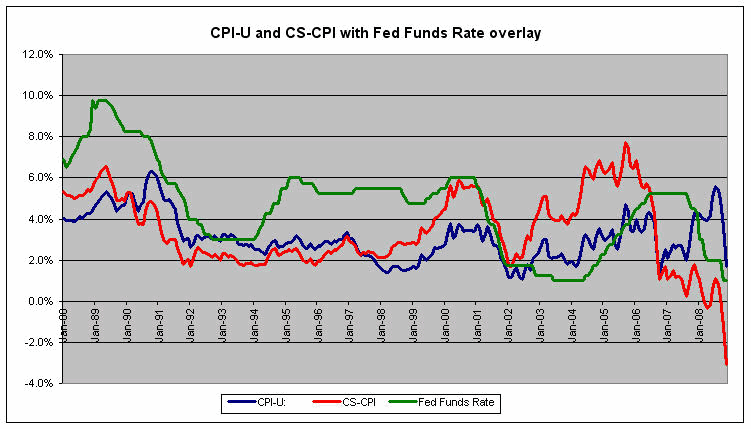
The following chart (courtesy of my friend "TC") shows what happens If one substitutes the Case-Shiller housing index for Owners' Equivalent Rent in the CPI.
Case-Shiller-CPI (CS-CPI)

In spite of massive cuts in the Fed Funds Rate to zero, real interest rates are still positive by 3.1%!
Data for the above chart is from two sources.
- Case Shiller December 2008 Release
- BLS Consumer Price Index Report for November 2008.

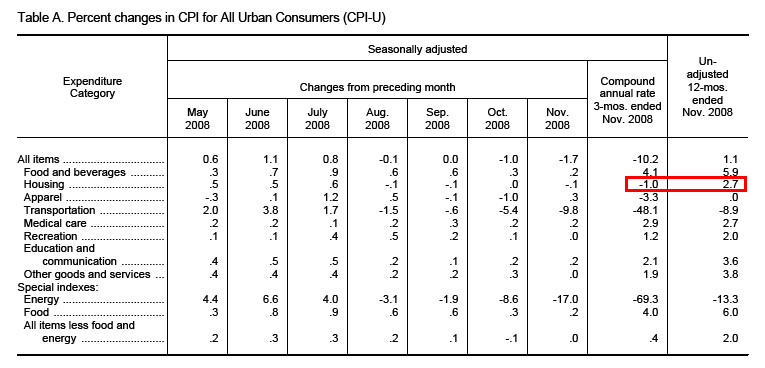
On a seasonally adjusted basis, the CPI-U decreased 1.7 percent in November, the second consecutive record decrease. For the 12 month period ending in November the CPI was up 1.1 percent, compared to 5.6 percent for the twelve months ending July of this year.
Notice the numbers in the red box. The BLS is reporting housing dropped .1 percent month over month but rose 2.7% year over year. In contrast the Case-Shiller 20 city composite is down 18% year over year.
Those watching the CS-CPI have not been shocked by the dramatic plunge in long term interest rates. Those watching CPI-U were screaming "bond bubble" and shorting treasuries at 5%.
10-year treasuries are now close to 2% and most missed the biggest bond rally in history.
In normal times with rents in sync with home prices, it did not matter much if one used OER or actual home prices. It's a remarkably different story now. We have just seen the biggest housing bubble in the history of the world. At the peak of insanity, home prices were 3 standard deviations above rental prices and 3 standard deviation above wage growth.
Now, the important factor is that home prices are crashing, with quite a big drop still needed to get back to historic norms. With that in mind, housing can be expected to be weak for quite some times.
The treasury market seems to have figured all this out quite nicely. Those screaming "treasury bubble" clearly have not.
In summer of 2005 the above chart shows the CPI at just over 4% with the Fed Funds Rate just under 4%. CS-CPI, a better measure of the CPI, was near a whopping 8%. Thus real interest rates were stunningly low starting in 2003. The Fed kept interest rates too low for two years. This clearly contributed to the housing bubble.
The Situation reversed in Autumn of 2006 with the Fed Funds rate at 5.25% and CS-CPI under 1%. This helped pop the bubble (a good thing) but it would have been better to not have the bubble in the first place.
Notes From "TC"
1. The "relative importance" or weight of OER has changed over time - it was 19.10 in 1987 and is now 23.942. I've included the yearly weight within the data.
2. The Case-Shiller 20 city composites represent sales that are a couple months old while the CPI reflects the previous month.
3. I've modified the CS-CPI to reflect the 20 city Case-Shiller index vs. the National Case Shiller index used in last month's chart. The quarterly national index lags by far too much.
4. For Nov 2008 the CS-CPI was a whopping negative 3.1% YOY as compared to a positive 1.7% for CPI-U.
5. The divergence between the two CPIs is increasing as the Government OER data continues to move higher. In fact since the housing market's peak in July 2006 the 20 city Case-Shiller index has declined over 24% while the Government's OER has increased nearly 7%. Deflation is clearly here, and the treasury market is responding to it. You just have to know where to look.
Do home prices belong in the basket?
I have had many people over past year tell me they do not care about home prices because they rent, or tell me that do not care about home prices because they own their home outright, or tell me they do not care about home prices because their house is a long term investment.
People may not care (or more realistically they may think they do not care), but the treasury market sure cares about something , and the most likely something is the destruction of wealth in housing along with the ramifications the housing market has on bank credit, corporate earnings, consumer attitudes, etc.
It's true that a person does not buy a home every week but that same person does buy food and gasoline every week. However, that does not make the price decline any less real. More importantly, it is naive to think treasuries should ignore the ongoing destruction of wealth in housing and the bank writeoffs that bust is causing.
Let's look at this from a practical standpoint. What's more important, home prices dropping $50,000 to $250,000 in value over the course of a few years or the price of gasoline going from $2.00 a gallon to $4.00 a gallon over the course of those same few years?
From a macro-economic standpoint, the correct answer to the above question is housing even though consumers were constantly griping about gasoline prices until the recent selloff. The easily seen is gasoline price hikes because people buy it every week. Practically speaking, the destruction of housing wealth matters far more. Here is the question to ask: How many tanks of gas will it take to equal the loss of $50,000 on a house?
On this basis, the so-called "irrational behavior" of the long bond specifically, and the entire treasury curve in general, does not seem so irrational.
Is there Justification For This Methodology?
For the record, I do not think it is possible to easily define and measure the prices of a representative basket of goods and services. However, CS-CPI makes more sense than the widely used CPI basket. It at least explains the so-called "irrational bond market" and also "Greenspan's Conundrum". I argue the treasury market could see the deflationary credit bust coming that Greenspan helped create.
Thus while one can dismiss the theory, I counter that it explains what happened in practice, and that is what matters. From a practical standpoint alone, housing is a consumption item requiring continual maintenance, not a bond one can hold to maturity and forget about. Also from a practical standpoint, CS-CPI properly accounts for home ownership instead of attempting to figure out how much rent one would pay renting a house from oneself.
Finally, the CS-CPI clearly show that the Fed overshot in both directions by misinterpreting or just plain ignoring the data that it had. This is further proof that it is time to abolish the Fed and let the market set rates.
By Mike "Mish" Shedlock
http://globaleconomicanalysis.blogspot.com
Click Here To Scroll Thru My Recent Post List
Mike Shedlock / Mish is a registered investment advisor representative for SitkaPacific Capital Management . Sitka Pacific is an asset management firm whose goal is strong performance and low volatility, regardless of market direction.
Visit Sitka Pacific's Account Management Page to learn more about wealth management and capital preservation strategies of Sitka Pacific.
I do weekly podcasts every Thursday on HoweStreet and a brief 7 minute segment on Saturday on CKNW AM 980 in Vancouver.
When not writing about stocks or the economy I spends a great deal of time on photography and in the garden. I have over 80 magazine and book cover credits. Some of my Wisconsin and gardening images can be seen at MichaelShedlock.com .
© 2008 Mike Shedlock, All Rights Reserved
Mike Shedlock Archive |
© 2005-2022 http://www.MarketOracle.co.uk - The Market Oracle is a FREE Daily Financial Markets Analysis & Forecasting online publication.


