


How to get "hundreds of dollars" of Extra Cash per Month, for 30 Years
Housing-Market / Mortgages Dec 31, 2008 - 11:45 AM GMTBy: Marty_Chenard

 NOTE: The markets are closed tomorrow. A very Happy New Year to all of you from Cindy and I. Many pit traders will be out on Friday. Schwab gave us indications that they would be on limited staff Friday and would reroute all Friday (Jan. 2nd.) orders through the Canadian exchanges. With that said, we may either take Friday off or do an abbreviated update.
Something to think about in early 2009 ...
Forget an Obama one year tax rebate ... how about a monthly change in your personal cash flow of $135 to $951 per month, each and every month for the next 30 years?
That's what the Fed is trying to deliver in their attempt to drive down 30 year mortgage rates to 4.5% or even 4.25%
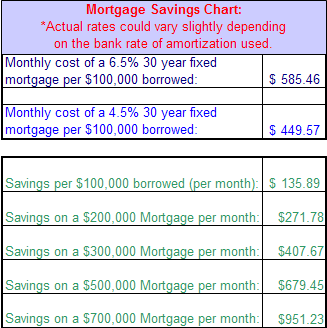
Take a look at today's "Mortgage Savings" chart below to see where you might fit in:
First, let's assume that a person currently has a 6.5% fixed, 30 year mortgage. Thirty year mortgage rates should hit 4.5% in the coming weeks . (It was announced last night that the Fed will begin purchasing $500 billion in Fannie Mae, Freddie Mac and Ginnie Mae securities early in January.)
Let's next assume that in the coming weeks, 30 year mortgage rates drop to 4.5%. How much could you save per month if you refinanced?
Depending on much you borrow, the savings could be as much as $679 per month on a $500,000 mortgage. To see how much you could save on different amounts, see the chart below.
The important point here, is that the monthly savings would be for the life of the mortgage ... 30 years.
How much would that be per year on a smaller $200,000 mortgage? Well, it would be a savings of about $271.78 per month, or $3,261.6 per year ... every year for 30 years. If you are sitting on a mortgage at a higher rate, this could be a smart 2009 financial move.
Final comments: I expect 30 year mortgage rates to drop to 4.5% with 1 point or less being charged. Many of you will be able to negotiate the "point charge" if you are dealing with a local bank and have a good credit record. Regarding a 4.25% possible rate: I think that will be a push. Even if we do get down to 4.25%, I expect that the banks are likely to raise the points charged at that level, so taking a 4.5% opportunity may be your best bet when it comes up. (Some solid, creditworthy borrowers with large down payments or lots of home equity are already reporting that they are seeing 4.5%.)
* See below for today's stock market update ...
We are now at the last trading day of the year. As we approach the end, what does the basket of Institutional "core holdings" look like?
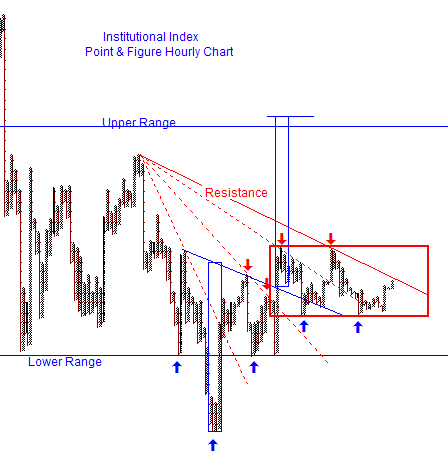
Below is an Institutional Index Point & Figure hourly chart. Two things are noticeable right now.
First, the Index of their very best "core holdings" have been in a trading range for the past 3 weeks.
Second, at yesterday's close, the index had worked its way up close to the half-way point of the range and, it will be facing an important resistance today and/or Friday. If it can break above that level, then the index (and the stock market) will move up to test the top of the index's trading range.
At that point, if the strength in the market has an appreciable improvement, then the Institutional index will have a chance of breaking through the trading range's upside resistance. (This chart is being posted daily on our paid subscriber site.)
*** Feel free to share this page with others by using the "Send this Page to a Friend" link below.
By Marty Chenard
http://www.stocktiming.com/
Please Note: We do not issue Buy or Sell timing recommendations on these Free daily update pages . I hope you understand, that in fairness, our Buy/Sell recommendations and advanced market Models are only available to our paid subscribers on a password required basis. Membership information
Marty Chenard is the Author and Teacher of two Seminar Courses on "Advanced Technical Analysis Investing", Mr. Chenard has been investing for over 30 years. In 2001 when the NASDAQ dropped 24.5%, his personal investment performance for the year was a gain of 57.428%. He is an Advanced Stock Market Technical Analyst that has developed his own proprietary analytical tools. As a result, he was out of the market two weeks before the 1987 Crash in the most recent Bear Market he faxed his Members in March 2000 telling them all to SELL. He is an advanced technical analyst and not an investment advisor, nor a securities broker.
Marty Chenard Archive |
© 2005-2022 http://www.MarketOracle.co.uk - The Market Oracle is a FREE Daily Financial Markets Analysis & Forecasting online publication.