Mike Paulenoff Forecasts for Gold, Oil & Stock Market
Stock-Markets / Exchange Traded Funds Dec 23, 2008 - 11:40 AM GMTBy: Mike_Paulenoff
 Technical strategist Mike Paulenoff, author of MPTrader.com, shares his chartwork early Tuesday on gold, oil, and equity indices ahead of the Christmas holiday.
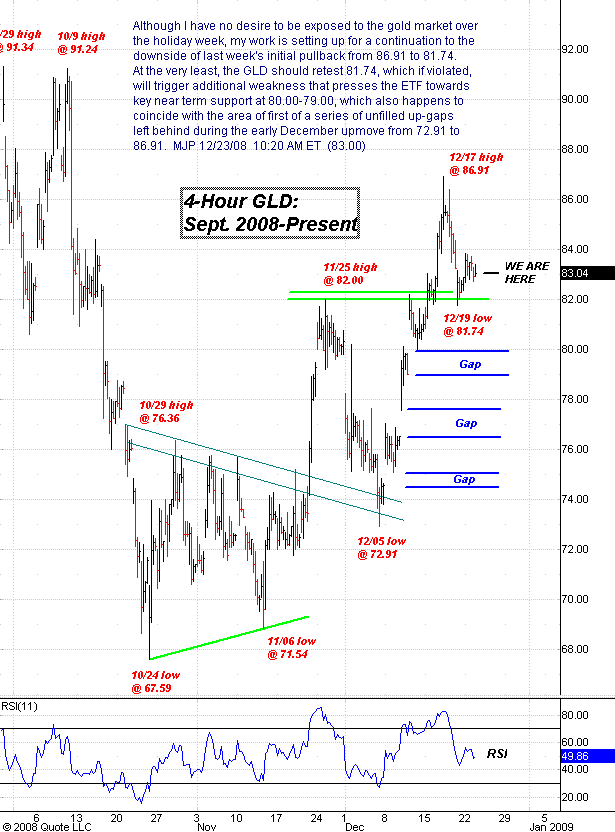
Gold: Although I have no desire to be exposed to the gold market over the holiday week, my work is setting up for a continuation to the downside of last week's initial pullback from 86.91 to 81.74 in the SPDR Gold Shares ETF (NYSE: GLD). At the very least, the GLD should retest 81.74, which if violated will trigger additional weakness that presses the ETF towards key near-term support at 80.00-79.00. That also happens to coincide with the area that is first of a series of unfilled up-gaps left behind during the early December upmove from 72.91 to 86.91.

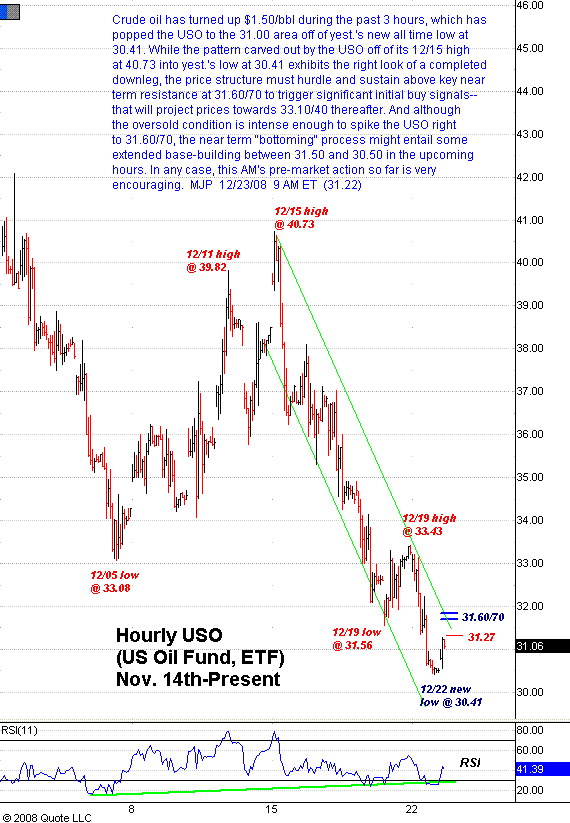
Oil: Crude oil has turned up $1.50/bbl during the past three hours, which has popped the US Oil Fund ETF (NYSE: USO) to the 31.00 area off of yesterday's new all-time low at 30.41. While the pattern carved out by the USO off of its 12/15 high at 40.73 into yesterday's low at 30.41 exhibits the right look of a completed downleg, the price structure must hurdle and sustain above key near-term resistance at 31.60/70 to trigger significant initial buy signals -- that will project prices towards 33.10/40 thereafter.
Although the oversold condition is intense enough to spike the USO right to 31.60/70, the near-term "bottoming" process might entail some extended base-building between 31.50 and 30.50 in the upcoming hours. In any case, this morning's pre-market action so far is very encouraging.

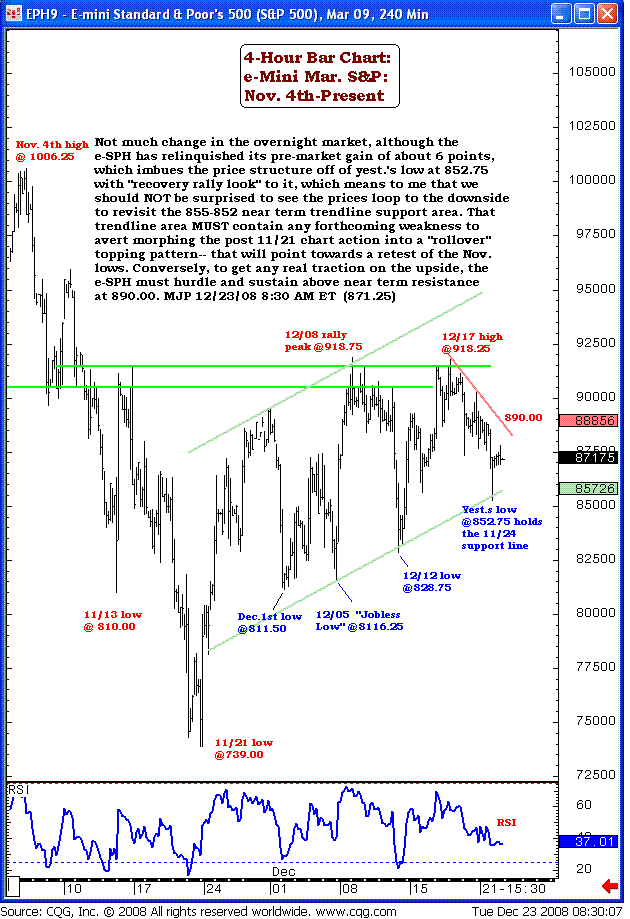
Equities: Not much change in the overnight market, although the e-Mini March S&P 500 futures chart has relinquished its pre-market gain of about 6 points, which imbues the price structure off of yesterday's low at 852.75 with "recovery rally look" to it. This means to me that we should NOT be surprised to see the prices loop to the downside to revisit the 855-852 near-term trendline support area. That trendline area MUST contain any forthcoming weakness to avert morphing the post 11/31 chart action into a rollover topping pattern -- that will point towards a rest of the November lows.
Conversely, to get any real traction on the upside, the e-Mini S&P must hurdle and sustain above near-term resistance at 890.00.
ETF Pricing: In case you are wondering, 35 of the 76 Proshares ETFs ... like SDS, QID, DXD, SMN... were subjected to capital gains distributions today (ex-dividend), which has skewed their prices significantly, and certainly (artificially) compromises the chart patterns. Be that as it may, in times like these, whichever ETF has a compromised chart pattern, I revert back to its inverse ETF, or to the underlying futures or to the cash index to provide continuity in my analysis.

Happy Holidays to everyone!
Sign up for a free 15-day trial to Mike's ETF Trading Diary today.
By Mike Paulenoff
Mike Paulenoff is author of the MPTrader.com (www.mptrader.com) , a real-time diary of Mike Paulenoff's trading ideas and technical chart analysis of Exchange Traded Funds (ETFs) that track equity indices, metals, energy commodities, currencies, Treasuries, and other markets. It is for traders with a 3-30 day time horizon, who use the service for guidance on both specific trades as well as general market direction
© 2002-2008 MPTrader.com, an AdviceTrade publication. All rights reserved. Any publication, distribution, retransmission or reproduction of information or data contained on this Web site without written consent from MPTrader is prohibited. See our disclaimer.
Mike Paulenoff Archive |
© 2005-2022 http://www.MarketOracle.co.uk - The Market Oracle is a FREE Daily Financial Markets Analysis & Forecasting online publication.


