Stock Market Dangerous Developments as Corporate Earnings Contract
Stock-Markets / Stocks Bear Market Dec 22, 2008 - 07:01 PM GMTBy: Brian_Bloom
 “One swallow does not a summer make”. (Aristotle) That may be true, but it’s possible that I saw two swallows today, and “summer” is not the season occupying my mind at present.
First, there were reports from across the Northern Hemisphere (USA, Canada, Europe and China) that the sudden cold weather “shouldn’t” be as cold as is being experienced. Commentators are clearly surprised by the ferocity of the savagely cold weather in an era of so-called “man-made global warming”.
Second was the little high/low price bar on the daily chart of the $SPX below (courtesy, decisionpoint.com)
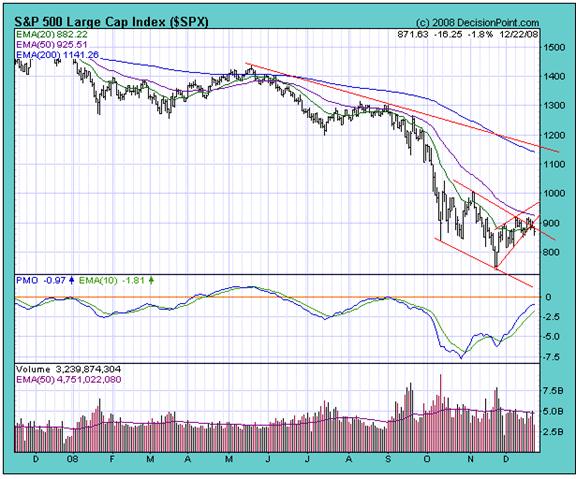
The position of the little price bar on the right hand side of the index chart may be a very dangerous development. Unlike the single swallow which may not be signaling the arrival of summer we should hope (perhaps pray) that the little bar is not signaling the arrival of a savage economic winter. Unfortunately, I have a horrible suspicion regarding the message the little bar may be delivering.
Perhaps it’s irresponsible to even talk about the economics oriented possibilities at this point, and perhaps my thinking is being colored by today’s weather, but as I have been openly questioning the conclusion of the IPCC scientists and their groupies for many months now my mindset is oriented towards facts rather than diplomacy. Perhaps the time has come to start facing some cold, hard facts and to bring these facts to the attention of more open minded readers.
To this analyst, the chart below (also courtesy decisionpoint.com) is arguably the most important chart of all. It illustrates the underlying “fundamental” health of the stock market.
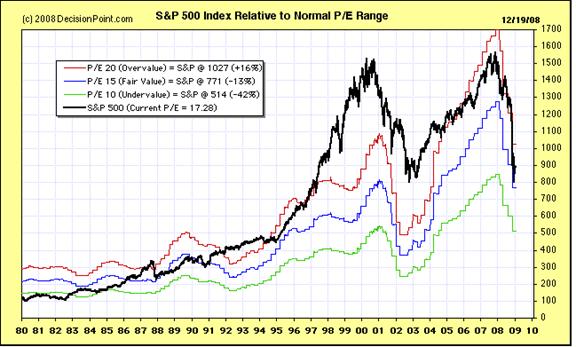
This chart is so important that the reader is entreated to think very carefully about what it is telling us.
Essentially, technical analysis is about monitoring the “mood” of the market and the Price:Earnings ratio is a reflection of that mood. What a Price:Earnings ratio means is that – if annual historical earnings are maintained – it will take x years for an investor to get his/her money back. For example, if an investor pays 90 cents for a share and the earnings of the underlying company are 9 cents a share per year, then it will take 10 years for the company to generate profits equal to what the investor invested – provided earnings remain constant!
Now, when times are good and investors are feeling optimistic, they typically expect the buoyant economic times to continue and they typically expect underlying earnings to grow. Therefore they will pay a price which gives rise to an above average Price:Earnings ratio.
The above chart shows that “average” or “fair value” is a P/E ratio of 15X. Historically, when investor enthusiasm waxes too great, P/E ratios rise to around 20X or more and the market as a whole becomes fundamentally overpriced (the black line relative to the red line).
By contrast, in bear markets, when P/E ratios fall to around 10X or less, the market as a whole becomes fundamentally undervalued (the black line relative to the green line).
What the reader is being asked to think about – and think very carefully about – is that the black line is the current P/E ratio of the market as a whole, and that the “current” P/E ratio is typically derived by dividing the current price by trailing (either historical annual or historical rolling 12 months) earnings.
In context of a recent statement by president-elect Obama to the effect that it might take years to fix the economy, what do we think will likely happen to future corporate earnings – particularly in context of CEO’s predispositions to pad historical earnings on a quarterly basis because their bonuses are (or used to be) performance related? (Nowadays, instead of going to jail for frivolously pouring shareholder money down the drain, CEOs who are fired for poor performance are given millions of dollars in the form of golden handshakes).
Let’s take one example: What do we think is going to happen to GM’s earnings over the coming quarter? Well, this analyst is prepared to take a flyer that GM’s earnings will not rise. If anything, the losses will likely be greater because GM’s CEO has to “prove” how important it is for the authorities to bail his company out. Arguably, if (historically) employee entitlements had been appropriately provided for, GM is already hopelessly insolvent and the flow-on implications of this are that earnings of those companies which supply GM (and those who supply them and so on, and so on) will fall as a consequence. The so-called “bail out” of GM by the authorities is not going to cause the demand for GM manufactured cars to rise in the coming quarter.
So, looking forward, if earnings fall across the board and if share prices remain exactly where they are today, then P/E ratios will rise. Does this sound reasonable to you? Should P/E ratios be rising if earnings are falling?
In 40 odd years of following the markets, if I have learned anything about the markets it is this: Emotion over-rides reason. When times are good, investors can only think rosy thoughts; and when times are tough investors can only think black thoughts. Therefore, Primary Bear Markets do not culminate when prices represent “fair value”. Therefore, if we are in a Primary Bear Market, we can expect P/E ratios to keep falling.
So, the question is: Are we in a Primary Bear Market?
I believe we are, and I believe we have been since early February 2008.
In this context, if earnings fall it is far more likely that P/E ratios will head south very quickly – as prices fall faster than earnings and as P/E ratios trend towards 8-10 X even as earnings are falling. In short, there is still another Bear Market leg to come before the Primary Bear Market ends. The only question in my mind is “when will the next leg begin to manifest?”
Which brings us back to that little price bar on the first chart.
There happen to be two separate chart formations on the first chart. The one shown is a rising wedge – which is typically bearish. If the lower boundary of a rising wedge is penetrated on the downside, then it is usual for prices to continue south at least until they have retraced the full upside distance of the wedge. i.e. Prices could fall – at least – to the low the market reached in November.
The second formation (not shown but easily imagined) is a diamond formation. A diamond formation may be a reversal formation of a continuation formation depending on circumstances. If the price breaks down from the rising wedge, it will also break down from the diamond and, under those circumstances it is highly likely that the diamond formation is a “continuation” formation – which implies that the November low will be taken out.
How far could the market fall if the November low is penetrated on the downside?
Well, think of it this way: If earnings remain constant and P/E ratios trend towards 10X from their current 15X, then the S&P 500 could fall by 33% - from 871 to 583.
Let’s get some context as to what a level of 583 means. Let’s have a look at the chart below – which dates back to 1920.
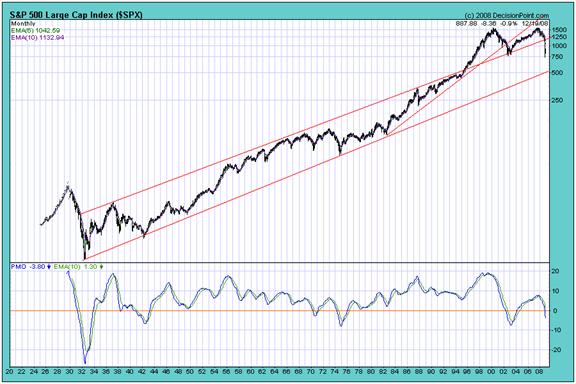
“Ooh-Aaah”, as Al Pacino might have put it. If earnings remain constant and if P/E ratios fall to 10X, then the S&P Index may come to rest on the 76 year trend line.
But what if earnings fall and P/E ratios fall to below 10X?
The reader’s attention is drawn to an article I wrote on June 4th, 2004 http://www.gold-eagle.com/editorials_04/bloom060904.html entitled “November 19th 2007”. In that article I speculated that humanity was possibly approaching the end of an era. Clearly, if earnings fall and if P/E ratios fall to 8-10X, then the S&P Industrial Index will penetrate below the lower rising trend line – thereby evidencing (factually as opposed to speculatively) that we have reached the end of an era. The era in question may be thought of as the era which prevailed from 1750 to 2000; the era of the Industrial Revolution.
Apart from the obvious financial implications, why is this a “dangerous” development? Why couldn’t it be a development that we welcome with open arms as humanity’s values revert to a period of caring about one another?
Well, this brings us back to the IPCC and the remarkably disingenuous attitude of the rat pack of politicians led by Al Gore – who won a Nobel Prize for his efforts, probably for the same reason that Al Greenspan was knighted by the Queen of England for his efforts: It is more rewarding to be popular than to be right.
What the IPCC scientists and their groupies are asking us to do is to bet the farm on the virtual certainty (in their view) that the colour red will come up on the next spin of the roulette wheel. But what if the colour black should come up? Do we lose the farm? Of course, if the world is heading for an Ice Age and we are unprepared for that eventuality, then the answer to that question will most certainly be “yes”.
Let’s get real here for a minute. No one on this little blue planet of ours can see the future. No one knows for certain whether we are headed for a period of further global warming or global cooling. All we can say for an absolute certainty is that our climate has been behaving strangely out of character in recent years.
The issue – from the perspective of society’s leaders – has to do with (and could still be) “risk management”. We needed to (and may still have time to) prepare for an either/or scenario. We need to rearrange our energy industries so that we can cope with either global warming or global cooling. And, in this context, the first step is staring us in the face:
Last week, 1.4 million homes in the North Eastern USA lost power as an Ice Storm blew in from the Arctic. Winter hadn’t even officially begun yet. I have been monitoring the power outages in the USA on a daily basis between December 1st and February 28th since 2006/7. In that year 4 million homes were temporarily without power because of winter related weather and in 2007/8 the number was similar. In 2008/9 the number is trending towards 2 million and winter has barely commenced.
Clearly, we need to reduce our dependence on overhead power lines. Clearly, if we think in terms of power generation closer to the point of consumption and if we think in terms of “clean” energy technologies (which are neither totally dependent on the sun – because the sun will be less potent if we are heading for cooling – nor dependent on nuclear fission; because nuclear fission is anything but “clean”) then we will survive either warming or cooling.
Beyond Neanderthal is a factional novel which took me decades to research and years to write and which was published in July 2008. In a sense, it may be thought of as a strategic plan for the planet; and it does not contemplate “bail-outs” as part of the strategy to ensure humanity’s survival. It can be ordered via www.beyondneanderthal.com and may well represent the most intelligent investment you could make at this point in time.
So, closer to home, what do we do at a personal level?
This article is not the appropriate place to address this question in any detail. However, from a financial perspective, the chart below (courtesy stockcharts.com) may offer a clue as to what “the market” is starting to think.
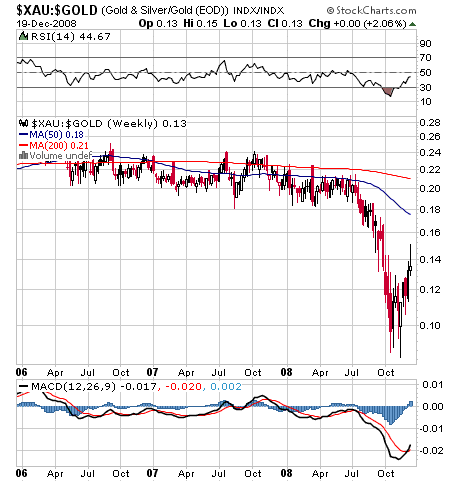
This chart is a ratio of the gold share prices to the gold bullion price. Quite naturally, gold shares should lead the gold price because the profits of gold mines are leveraged to the price of gold. If a gold mine is making profits, then every dollar by which the gold price rises translates (roughly) into an extra dollar of profits. By contrast, if the gold price falls then every dollar by which the gold price falls will translate roughly into a shrinkage of mine profits of one dollar per ounce.
In August 2008 the market began to panic about the possibility of an impending collapse of the gold price – as evidenced by the fact that the ratio of gold share prices to the bullion price literally fell out of bed. Now, however, the MACD oscillator at the bottom of the chart is pointing to a possible reversal of the market’s perspective. The market appears to be reconsidering its view that the gold price will keep falling, and may even be expecting the gold price to rise further from here after consolidating. (Note: The gold price may fall in the short term. This is not an analysis which is focusing on day-to-day trading opportunities)
This view is put into perspective by the point and figure chart of the same ratio as shown below. (Courtesy stockcharts.com)
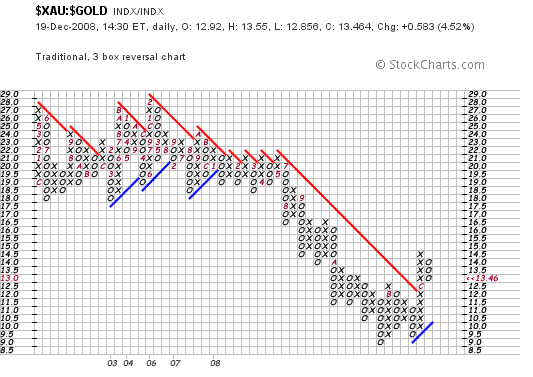
Clearly, the prevailing trend line (direction of travel of the ratio) is no longer pointing down.
Summary and Conclusion
Regardless of whether we agree or disagree on what “should” be happening, the evidence suggests that the following “is” happening:
- Corporate Earnings are under pressure and Price:Earnings ratios do not yet reflect this fact.
- A tentative sell signal has been given (one swallow) which “may” be evidencing the possibility that the P/E ratios will begin to shrink sooner rather than later.
- The argument of the IPCC scientists and their groupies is being severely tested by the emergence of viciously cold weather across the Northern Hemisphere.
- The ratio of gold shares to the gold bullion price is giving signals of a “possible” impending change in the Primary Direction of the gold price
Author’s Note
The implications of all of the above are very sobering. The very idea that the world’s economy can be put back on track by throwing money at it is so off-the-wall that it may be causing our politicians to take their eye off the main issues – which are that Neanderthal Fire has passed its use-by date and that we need to be moving away from both internal combustion engines and centralized power generation.
There are technical solutions, for example it is demonstrably possible to improve gasoline consumption in an internal combustion engine by up to 50% by the addition of hydrogen, and this saving will offset the issue of hydrogen being an energy sink. For example, with a combination of solar and wind technologies it is possible to produce energy closer to point of consumption and there are technologies emerging which will allow for efficient storage of electricity. However, the issues which face us are so serious that the implementation of these solutions cannot be left to profit-oriented Private Enterprise. Their implementation needs to be co-ordinated in some manner. We can no longer tolerate the emotional predisposition to argue that Private Enterprise is the only game in town. Under current circumstances, such an argument is both naïve and counterproductive.
By Brian Bloom
Beyond Neanderthal is a novel with a light hearted and entertaining fictional storyline; and with carefully researched, fact based themes. In Chapter 1 (written over a year ago) the current financial turmoil is anticipated. The rest of the 430 page novel focuses on the probable causes of this turmoil and what we might do to dig ourselves out of the quagmire we now find ourselves in. The core issue is “energy”, and the story leads the reader step-by-step on one possible path which might point a way forward. Gold plays a pivotal role in our future – not as a currency, but as a commodity with unique physical characteristics that can be harnessed to humanity's benefit. Until the current market collapse, there would have been many who questioned the validity of the arguments in Beyond Neanderthal. Now the evidence is too stark to ignore. This is a book that needs to be read by large numbers of people to make a difference. It can be ordered over the internet via www.beyondneanderthal.com
Copyright © 2008 Brian Bloom - All Rights Reserved
Disclaimer: The above is a matter of opinion provided for general information purposes only and is not intended as investment advice. Information and analysis above are derived from sources and utilising methods believed to be reliable, but we cannot accept responsibility for any losses you may incur as a result of this analysis. Individuals should consult with their personal financial advisors.
Brian Bloom Archive |
© 2005-2022 http://www.MarketOracle.co.uk - The Market Oracle is a FREE Daily Financial Markets Analysis & Forecasting online publication.


