Fed Fights Deflation with Zero Interest Rates
Interest-Rates / US Interest Rates Dec 17, 2008 - 11:33 AM GMT

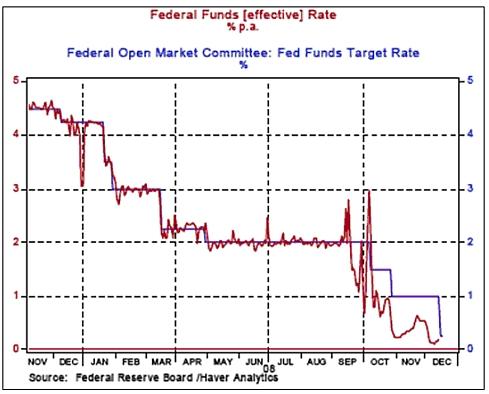
 The US Federal Reserve yesterday pulled out all the stops in a frantic effort to save the US economy from collapse and stem the deflationary forces. The Fed funds rate was slashed from 1% to a target range between 0 and 0.25% – the lowest the central bank's key rate has been since records began in 1954.
In reality, the Fed is simply aligning its target rate with the effective rate and thereby pushing monetary policy into an era of Zirp, i.e. a zero-interest-rate policy.
The Federal Open Market Committee's (FOMC) statement said the “outlook for economic activity has weakened further” from its previous meeting in late October, indicating that the “Federal Reserve will employ all available tools to promote the resumption of sustainable economic growth and to preserve price stability”. The statement also discussed specific actions that would move the Fed further toward quantitative easing.
In my opinion, the Fed's communiqué in reality signaled the large-scale monetizing of the US debt markets.
Hat tip: Mish, Global Economic Analysis
Sharing my sentiments, Bill King ( The King Report ) commented: “Ben Bernanke and the Fed just screwed everyone in the US, and some abroad, that played by the rules, was prudent and live on fixed incomes. Ben, just like Easy Al, is once again redistributing wealth from the prudent, the savers and retirees to the reckless and the boobs that created this mess. But the Fed, via its communiqué, is admitting that it is petrified of what is occurring in the economy and financial system so it is now in all-out money/credit dump mode.”
An e-mail just received from Bennet Sedacca ( Atlantic Advisors Asset Management ) said: The “Fed has declared war on prudence and savers and rekindled the ‘Moral Hazard Card' – except this time, I believe they have created the largest moral hazard ever seen. Of note is that this intervention has occurred in the third week of the month (options expiry for the greatest impact – playing games with an already dysfunctional system that they created) and may force prudent, risk-avoidance types, to take risk, at precisely the wrong time.
“I respect markets, and will not sell short against this force that seems invincible, but as always, will remain cognizant of the Big Picture, one that Bernanke and Co. cannot see, it seems. In fact, it feels like they are making a mockery of our system, that they are desperate and will print enough dollars that will force other central bankers to do the same.
“With stated short-term interest rates at 0 (and likely to stay there for the foreseeable future), 30-year Treasuries at 2.7% and stocks at gargantuan price/earnings ratios, we will look to continue to protect our investor's capital as we have done to date. I do not like being forced into a game of ‘Liar's Poker'.”
With Treasuries and agency debt potentially subject to a great deal of price risk at these levels, and the US dollar appearing to be topping out, where does the Fed's “betting the ranch” policy leave the stock market?
Firstly, for some historical perspective, the MSCI World Index and the MSCI Emerging Markets Index have improved by 18.9% and 23.2% respectively since the November 20 lows. As far as the US markets are concerned, the Dow Jones Industrial Index has gained 18.2% since the low, the S&P 500 Index 21.4%, the Nasdaq Composite Index 20.8% and the Russell 2000 17.1%.
In addition to the Fed's attempts to inflate asset prices, there are a number of short-term positives for equities.
(1) The period post Thanksgiving through the end of the year has usually been a bullish time for stocks, based on studies by Jeffrey Hirsch ( Stock Trader's Almanac ).
(2) With the exception of the Russell 2000 Index, all the major US indices yesterday breached their 50-day moving averages. Should the bullish seasonal tendencies provide a further tailwind, the next targets for the various indices are the November 4 highs and the key 200-day moving averages, as shown in the table below. On the downside, the December 1 lows (not shown in the table) must hold for the rally to remain intact.
The number of S&P 500 stocks trading above their respective 50-day moving averages has increased to 53.4% from almost zero in October. However, only 5.4% of the index constituents are trading above their 200-day lines.
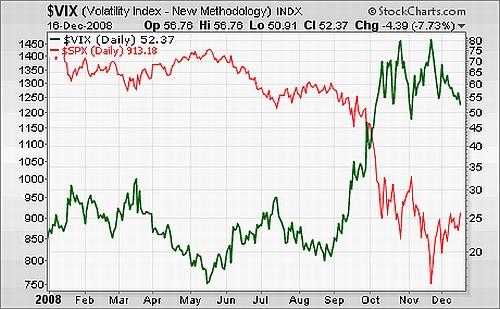
(3) The CBOE Volatility Index (VIX) (green line) has declined from the 80s in October and November to 52.4 yesterday. It is not uncommon for short-term volatility to be at extreme levels at bottom turning points, and for stocks to improve as the “storm” grows quieter.
(4) I have mentioned in a previous post that “for a more lasting market turnaround to happen, I would like to see … a 90% up-day …” Yesterday was likely another 90% up day, the first since December 1. The Lowry's figures are looking better and the Buying Power Index has just broken out above its declining trend line.
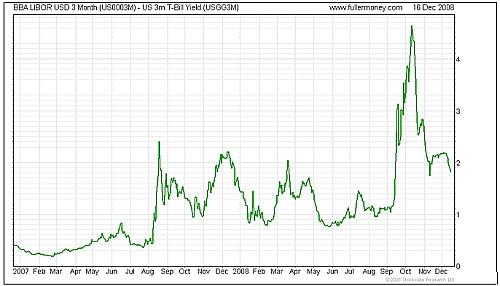
(5) Since the peak of the TED spread (i.e. three-month dollar LIBOR less three-month Treasury Bills) at 4.65% on October 10, the measure has eased to 1.83%. Although this measure is moving in the right direction, credit spreads need to narrow further to indicate that confidence is returning and liquidity is starting to move freely again.
(6) On a fundamental note, it is hard to get a grip on the “E” component of price-earnings multiples, but it will be remiss to ignore the fact that 39% of the constituents of the MSCI World Index sell at a discount to shareholders' equity. “The cash-rich companies allow investors to pay nothing for future earnings streams,” said Jean-Marie Eveillard in an interview with Bloomberg .
(7) Markets have been shrugging off bad news since the poor ISM manufacturing and payrolls data of two weeks ago. I quoted Richard Russell ( Dow Theory Letters ) in my “ Words from the Wise ” review on Sunday, saying: “This is all the more dramatic since this potential upturn has arrived in the face of black-bearish news. Markets bottoming and rising in the face of bearish news are often the most profitable ones. I have never seen a bear market hit its low amid happy news headlines.”
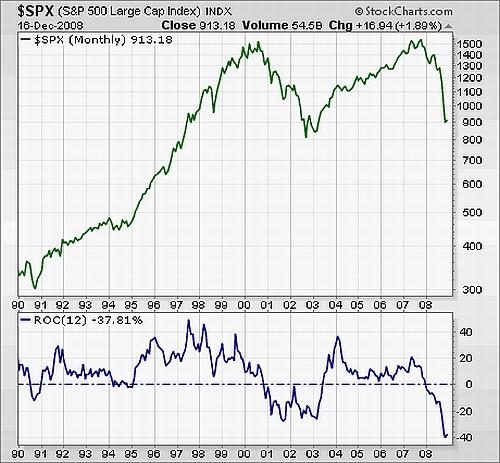
Notwithstanding the improvement since the November lows, it remains too early to tell whether a secular low has been recorded. The chart below shows the long-term trend of the S&P 500 Index (green line) together with a simple 12-month rate of change (or momentum ) indicator (blue line). Although monthly indicators are of little help when it comes to market timing, they do come in handy for defining the primary trend. An ROC line below zero depicts bear trends as experienced in 1991, 1994, 2000 to 2003, and again since December 2007.
Stock markets are still caught between the actions of central banks furiously fending off a total economic meltdown on the one hand, and a worsening economic and corporate picture on the other. The rally may have more legs, but failing further technical and fundamental evidence, I remain distrustful as to whether “this is it”.
Did you enjoy this post? If so, click here to subscribe to updates to Investment Postcards from Cape Town by e-mail.
By Dr Prieur du Plessis
Dr Prieur du Plessis is an investment professional with 25 years' experience in investment research and portfolio management.
More than 1200 of his articles on investment-related topics have been published in various regular newspaper, journal and Internet columns (including his blog, Investment Postcards from Cape Town : www.investmentpostcards.com ). He has also published a book, Financial Basics: Investment.
Prieur is chairman and principal shareholder of South African-based Plexus Asset Management , which he founded in 1995. The group conducts investment management, investment consulting, private equity and real estate activities in South Africa and other African countries.
Plexus is the South African partner of John Mauldin , Dallas-based author of the popular Thoughts from the Frontline newsletter, and also has an exclusive licensing agreement with California-based Research Affiliates for managing and distributing its enhanced Fundamental Index™ methodology in the Pan-African area.
Prieur is 53 years old and live with his wife, television producer and presenter Isabel Verwey, and two children in Cape Town , South Africa . His leisure activities include long-distance running, traveling, reading and motor-cycling.
Copyright © 2008 by Prieur du Plessis - All rights reserved.
Disclaimer: The above is a matter of opinion and is not intended as investment advice. Information and analysis above are derived from sources and utilizing methods believed reliable, but we cannot accept responsibility for any trading losses you may incur as a result of this analysis. Do your own due diligence.
Prieur du Plessis Archive |
© 2005-2022 http://www.MarketOracle.co.uk - The Market Oracle is a FREE Daily Financial Markets Analysis & Forecasting online publication.


