


Gold Rallies as Precious Metals Stocks Soar
Commodities / Gold & Silver Dec 14, 2008 - 11:29 AM GMTBy: Merv_Burak

 A nice weekly move by the metals but boy did the stocks move. Most gold Indices were making gains in the 20% area while the Merv's Spec-Gold Index gained 32.1%. We should not expect gains like this to come along very often but enjoy them when they do.
GOLD : LONG TERM
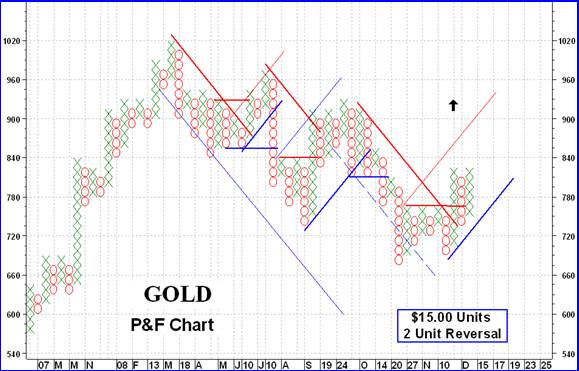
When the bull market in gold started several years ago the long term P&F chart remained bullish throughout, with only two reversals of trend up to its top in 2008 (one to the bear side and one back to the bull). Since it started its downward trek this year it has had 5 reversals of trend and the year is not quite over yet. Although it has been overall bearish it seems that there are a lot of speculators just aching to get back into a gold bull market. Maybe this time they will turn it around for good and we will see new highs.
Although nothing much has changed from the long term ratings stand point the weekly move in gold has put it closer and closer to some kind of ratings improvement very soon, should the move continue. The P&F chart has had its ups and downs lately but has remained within that last bull signal with a projection to the $930 area. Nothing yet on that chart to suggest it will not make it. As for the normal charts and indicators, they are moving in the right direction but still not enough to change the rating significantly. Gold remains below its negative moving average line but not far below. In fact gold is just about touching the line so it would take very little more upside for gold to break above. The momentum indicator, although not all that strong, is showing some positive action. It has just barely inched its way above its neutral line into the positive zone. Of greater interest is the fact that it is comfortably above its positive sloping trigger line. The volume indicator is moving higher but not with any vigor. It is above its trigger line but the line slope is still to the down side. As things start to improve the rating should improve. With the momentum indicator showing a positive trend the long term rating can be upgraded but only to a – NEUTRAL level for now. Crossing of the moving average line by the gold price would be a big plus.
INTERMEDIATE TERM
Every week it seems that the gold price moves above or below its moving average line. This week it is once more above the line and the line has turned to the up side. The momentum indicator is once more in its positive zone above its positive trigger line. As for the volume indicator, it remains above its positive trigger line but still seems to be going nowhere except in a basic lateral direction. All in all, the intermediate term rating for gold is BULLISH at this point.
SHORT TERM
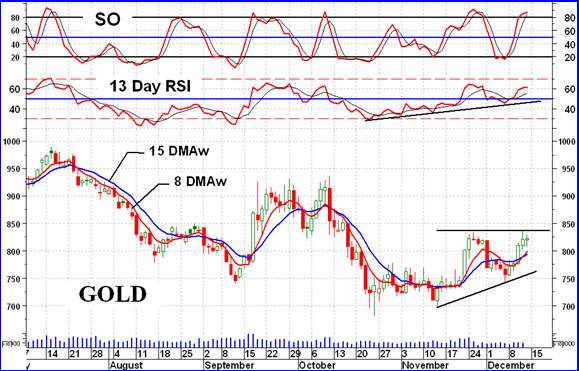
On the short term things change rapidly. Since the middle of Oct the short term momentum indicator has been in an up trend but for now can't make up its mind if it wants to stay in the positive or negative zone. After Friday's close it is in the positive zone and above its positive sloping trigger line. As for gold itself, that is a nail bitter right now. Will it break above the previous high or not? The daily volume action does not suggest any great underlying pressure to do so. The daily volume has been relatively low and needs to perk up if we are going to continue in the upward direction. At this time the indicators give me a BULLISH short term rating but that could quickly change should the previous high not be breached, and soon.
The aggressive Stochastic Oscillator has entered its overbought zone so we could expect a reaction from these levels. Does that mean a new down move? Not necessarily. It could only mean an upward hesitation. The gold price itself does look like it has topped out but let's give it another day or two to validate such topping, or not.
SILVER
On the P&F chart shown last week we have reversed direction and are now moving in an upward direction with X's back at the $10.50 resistance level. A move to $11.00 by silver would be a bullish break-out with a projection to the $17.50 level.
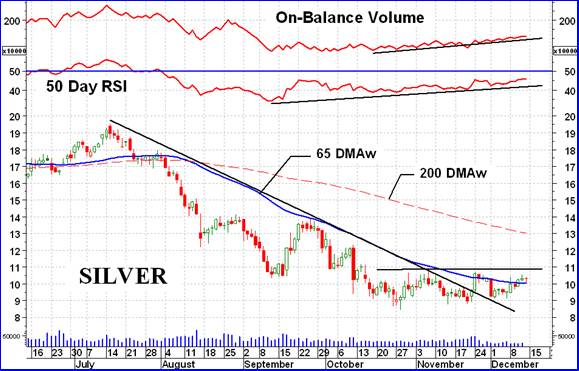
In the past several weeks as gold has tried to rally silver has stayed relatively flat. However, its momentum and volume indicators have not. Both can be seen as positive trends above well defined up trend lines. This is encouraging and although the momentum indicator has not yet breached its neutral line it is heading in that direction and should get there very soon. It is at the level it previously was at back in Sept. The volume indicator also continues to move higher and is back to its Sept level. The price needs some catching up to do. The P&F chart indicates an $11.00 break-out level and that looks fine on the Candlestick chart also. A break-out would most likely send the momentum indicator above its neutral line for confirmation, if it had not done so earlier. Everything point towards an upside break but wait for the event to happen, surprises can always occur.
PRECIOUS METAL STOCKS
As mentioned above, the precious metal stocks had a roaring good time this past week. Index moves in the 20% range were the norm. Although there were still individual stocks that did not participate in the week's move the universe of 160 stocks did participate. The one group that was a lagging group was the Merv's Gamb-Gold Index with a gain of only 8.1%, well below the average of the universe. Although there were 10 stocks (out of the 30 in the Index) that gained more than 20% on the week there were also a few that had similar negative moves which brought down the gambling average.
Looking at the Table of Technical Information & Ratings (below) everything looks great from the short and intermediate point of view but not yet from the long term view. Summing up the ratings of the 160 stocks in my Gold & Silver 160 Index, and using daily data rather than the weekly data used in the tables, I get bullish and bearish ratings as follows: short term BULL 75%, BEAR 21%; intermediate term BULL 46%, BEAR 45%; long term BULL 11%, BEAR 86%. So, although we had a very good week we still need a little more upside to get the intermediate term bullish rating above the 50% mark and as for the long term, that's some time in the future.
Merv's Precious Metals Indices Table
Well, let's call it another week.
By Merv Burak, CMT
Hudson Aero/Systems Inc.
Technical Information Group
for Merv's Precious Metals Central
For DAILY Uranium stock commentary and WEEKLY Uranium market update check out my new Technically Uranium with Merv blog at http://techuranium.blogspot.com .
During the day Merv practices his engineering profession as a Consulting Aerospace Engineer. Once the sun goes down and night descends upon the earth Merv dons his other hat as a Chartered Market Technician ( CMT ) and tries to decipher what's going on in the securities markets. As an underground surveyor in the gold mines of Canada 's Northwest Territories in his youth, Merv has a soft spot for the gold industry and has developed several Gold Indices reflecting different aspects of the industry. As a basically lazy individual Merv's driving focus is to KEEP IT SIMPLE .
To find out more about Merv's various Gold Indices and component stocks, please visit http://preciousmetalscentral.com . There you will find samples of the Indices and their component stocks plus other publications of interest to gold investors.
Before you invest, Always check your market timing with a Qualified Professional Market Technician
Merv Burak Archive |
© 2005-2022 http://www.MarketOracle.co.uk - The Market Oracle is a FREE Daily Financial Markets Analysis & Forecasting online publication.