


A look at Stock Market Psychology
Stock-Markets / Trader Psychology Apr 17, 2007 - 12:52 AM GMTBy: Clif_Droke

The past five days were bullish, overall, for the stock market. That isn't surprising given the level of bearish sentiment we saw in last week's AAII investor sentiment survey. This week's AAII poll, released Thursday, showed a slight increase in bullish sentiment (41%) over bearish sentiment (38%). That's not enough of a disparity between the bulls and the bears to cause any overt worries in the immediate term, but it's enough to slightly increase our caution.
The still rising dominant internal momentum indicator for the NYSE, the 200-day HILMO index, should act as a strong underlying support for anything unusual that gets thrown at this market in the coming weeks. The interim trend remains bullish.
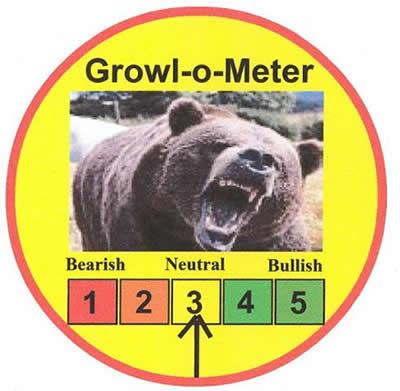
In the immediate term, however, investor psychology isn't as strong as it was earlier this month. The Growl-o-Meter is a proprietary indicator for measuring investor psychology in the stock market on an immediate-term basis (i.e., 5-10 days). The readings for the Growl-o-Meter are taken each week and assigned a numerical value from 1 to 5. The values of each number on the meter are shown below:
1 - Very bearish
2 - Mildly bearish
3 - Neutral
4 - Mildly bullish
5 - Very bullish
The meter readings are assigned each week based on the following four components: 1.) AAII Investor Sentiment Survey; 2.) In-house market psychology poll conducted by www.clifdroke.com ; 3.) Pessimistic or fear-laden headlines in the leading financial newspapers; 4.) ARMS Index reading for the current week.
The indicator is one way of gauging the stock market's psychological profile for the current week. When the readings of the meter are high (4-5) it favors a bullish trading stance. Lower readings (1-2) mean extreme caution is advised. The current Growl-o-Meter reading is strictly an immediate-term consideration (i.e., 5-10 days). The very latest reading shows that market psychology has pulled back from last week's bullish reading to a neutral reading (see graph below). It therefore wouldn't be surprising to see an increase in resistance in the very short term.
Isn't it interesting that on Friday, April 13, the S&P 500 index completely recovered its losses following the Feb. 27 panic sell-off? This of course was preceded by the NYSE Composite index a few days ago (which also made a new all-time high on Friday). It also further proves the point that an event-driven selling panic is always completely retraced, a message we've been pounding ever since the panic started.
Both the NYSE Composite index and the Emerging Market ETF (EEM) made new highs on Friday, April 13. This underscores the fact that the dominant trend for the stock market is still up in the intermediate-term, notwithstanding the possibility for a short-term correction.
Speaking of the EEM, in earlier March I mentioned that Emerging Markets ETF was sending a bullish signal since the correction following the Feb. 27 sell-off. EEM has since recovered to new highs, led in large part by the shipbuilders. We talked about the EEM showing a positive divergence (i.e., higher lows) in March while the S&P 500 (SPX) made a lower low. This positive divergence in EEM told us two things: 1. the correction in the SPX would soon reverse since EEM has been a reliable leading indicator for the SPX; and 2. the world economy is still expanding contrary to the doomsayers.
Another good proxy for global economic expansion are the stocks of shippers and ship building firms. To get an idea of how well the shippers have been doing of late, check out the symbols of the following stocks. Keep in mind these aren't necessarily formal recommendations but just references: TNT, ALEX, SFL, and ISH. The bottom line is, as goes shipping, so goes the global economy. This means it will pay to keep a watchful eye on the shipping stocks in the months ahead for the *real* pulse of global economic strength or weakness.
By Clif Droke
www.clifdroke.com
Copyright ©2002-2007 Clif Droke - Publishing Concepts
Clif Droke is editor of the 3-times weekly Momentum Strategies Report which covers U.S. equities and forecasts individual stocks, short- and intermediate-term, using unique proprietary analytical methods and securities lending analysis. He is also the author of numerous books, including most recently "Turnaround Trading & Investing." For more information visit www.clifdroke.com
© 2005-2022 http://www.MarketOracle.co.uk - The Market Oracle is a FREE Daily Financial Markets Analysis & Forecasting online publication.