Gold- How to Make Cycles Work in Your Favor
Commodities / Gold & Silver Dec 10, 2008 - 09:32 AM GMTBy: Peter_Degraaf
 Our lives consist of and are controlled by cycles. From the 1 second heartbeat cycle, to the 1,000 year millennium cycle and many other cycles in between, we live and die within cycles. The ‘ three score and ten' human cycle is simply a part of it all.
King Solomon understood cycles:
“That which has been is what will be. That which is done is what will be done, and there is nothing new under the sun.” 940 BC; Ecclesiastes 1:9
One of the most important cycles in history is the Civilization Cycle.
It runs its course over approximately 200 years and consists of the following characteristics:
- Bondage ( USA pre- 1776)
- Spiritual Faith ( USA 1620 - 1776)

Pilgrims landing at Plymouth Rock Dec 21 1620 ; (painting by Corne).
- Great Courage ( USA 1776; Many of the Founding Fathers suffered catastrophic financial losses and some were killed by the British army).
Washington shown crossing the Delaware , painting by Emanuel Leutze.
- Liberty ( USA 1776 - ?)
- Abundance (USA 1800 – 1953 when the gold at Fort Knox was last audited and reported to be 8133 metric tonnes).
- Selfishness ( USA 1960 - ? as the ‘gimme' generation arrived on the scene).

- Complacency ( USA 1970 - ? Illiteracy rising, large numbers of people ignorant as to who their leaders are. Many not bothering to vote).
- Apathy ( USA 1980 - ? A growing disregard for rules and authority, massive greed among a number of Wall St. ‘hot shots'.
- Risk taking ( USA 1990 - ? Gambling on the increase, casinos everywhere. Banks and businesses willing to take on more and more risk, as money becomes more readily available, thanks to a willing Central Bank – this is the third such banking institution in US history!)
- Dependence. USA (2008 -? Recent exit-polling of the presidential race showed that large numbers of voters knew nothing about the qualifications of the president-elect, but were attracted by slogans and the promise of ‘tax reductions'. Presently 40% of US citizens pay no taxes at all, and the number of people who receive government checks is at an all-time high).
You ask me what comes next in this cycle. Unfortunately, and historically, it is back to bondage. It will not happen overnight, but the economic tremors we are witnessing all but guarantee that it will happen. Thus far 26 civilizations have come and gone. The average length was 200 years. After 232 years the USA is ‘mature.'
----------
“A democracy is always temporary in nature; it cannot exist as a permanent form of government. It will only exist until the voters discover they can vote themselves largesse from the public treasury.” A.F. Tytler, Scottish economist, 1747 – 1814.
-----------------
Within these long-term cycles the words of Hyman Minsky apply: “The longer things remain stable, the greater the period of instability that will follow it.”
-------------------
The Economic Cycle, sometimes referred to as the Kondratieff wave, usually lasts from 50 – 70 years. It begins and ends with a depression. The last bottom was in 1932. It is made up of the following components:
• Depression.
• Thrift (savings rise).
• Confidence.
• Investment.
• Economic activity.
• Individual wealth increases.
• Use of debt.
• Inflationary boom.
• Debt made easy by the banking system.
• Misuse of debt, poor investments, poor collateral.
• Loss of confidence.
• Panic
The scene is a ‘bank run' at the Union Bank in New York, 1929. Between 1929 and 1935 some 9000 US banks failed.
• Depression.
I'll leave it to the reader to determine where we are in this cycle. The 1929 crash and depression was caused by loose monetary policies at the Central Bank, and if the USA goes through a depression this time, it too will have been caused by the Central Bank, along with Congressional laxness in mortgage lending standards.
The trillions of dollars in new credit that is now being created all but guarantees that the mal-investments of the past will be repeated.
The irony is that we should not have to go through a depression. It is government and Central Bank tinkering with economics that causes depressions.
Depressions derive a lot of negative energy (think implosion), from people changing from spending to saving. The spending of money causes economic activity to continue, as entrepreneurs produce goods and services for the consumer to buy. When the consumer stops spending and begins to save, economic activity slows, and people lose jobs while companies go bankrupt. If the government keeps its hands off, the depression can begin and end quickly, but history shows that governments use depressions to increase their power base. Franklin D. Roosevelt greatly increased the size and influence of government during the last depression.
Incoming Chief of Staff Rohm Emmanuel has stated that: “We cannot let this financial crisis go to waste. Opportunities present themselves to introduce legislation that would otherwise not be possible.”
------------
Richard Kelly Hoskins researched war cycles over a 250 year period. He concluded that war cycles usually last about 22 years from bottom to top. After 22 years people grow tired of seeing fathers and sons going off to war and not coming back. According to Hoskins the War Cycle tops for the last 100 hundred years came in 1918, 1945, and 1975. The top for the current ‘War on Terror' is not expected till 22 years from 2001, thus 2023. Wars are very expensive, and have always had price inflation during and after the war, as monetary inflation is used to fuel the war effort.
---------------
“ Every few hundred years in Western Civilization there occurs a sharp transformation; …within a few short decades, society re-arranges itself, it's worldview, its basic value, its social and political structure, its key institutions. Fifty years later the result is a new world.” …. Peter Drucker
----
For investors the most important cycle (next to the life cycle), is the commodity super-cycle. Since 1803 there have been 5 super-cycles. The average length was 22 years from bottom to top. The latest (#6) started in 2001 and is likely to last until 2023. (Some studies show an average length of 18 years, which would cause the current one to end in 2019).
Commodity booms are fueled by investors turning their backs on ‘paper investments' such as stocks and bonds, and buying up ‘bricks and mortar', as well as resources and resource stocks. The fuel for a commodity boom is often a mismanaged money supply (monetary inflation).
A few years ago James Flanagan did a study of the 25 most recent commodity price rises, after new highs were posted , 17 of the 25 rose 30% or more, while 10 of the 25 rose 60% or more. The majority rose to these levels in the next 3.5 months!
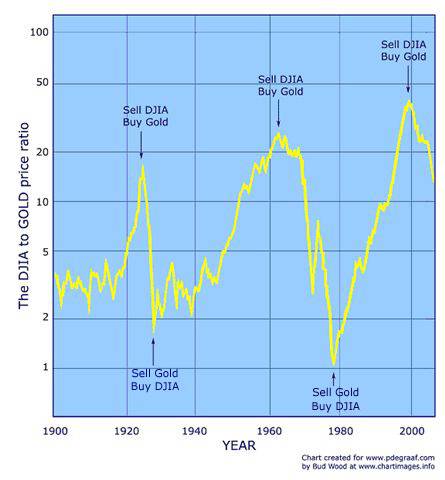
In visual form the commodity trend is often portrayed in the following chart which depicts the ratio that exists between gold and the DJIA:

Thanks to Bud Wood for this chart. The current investment climate is very ‘commodity-friendly'. The incoming President has committed himself to spending close to a trillion dollars to upgrade the US infra-structure. This will require a lot of steel, copper, zinc, lead, molybdenum and cement, as well as gas and oil to power the machinery.
Meanwhile, the money that will be created to pay for these goods and services will filter through the economy and water down the existing money supply, similar to adding water to a partially filled glass of milk.
The inevitable outcome will be higher precious metals prices.
While the chart shown above will likely continue to show a decrease in the gold/DOW ratio (gold outperforming stocks), we can expect both gold and the DOW to rise, with gold outpacing the main stream stocks. The reason is simple: monetary inflation causes price inflation. It always has, it always will. Generic stocks will benefit, but gold will benefit more.
When governments spend more money than they take in through taxes, and when they do this while revenue is dropping (as it is now, due to business cutting back and unemployment rising), the resulting deficits grow exponentially. Compare it to opening your hands while keeping the wrists together. The further from the wrists, the wider the opening. One hand represents income, the other outflow. The expectation is for a trillion dollar deficit during the first year of the Obama presidency.
Governments are growing desperate to keep their economies growing. The Australian government a few days ago distributed 8 billion dollars (5.2 billion US ), directly to consumers, hoping this would stimulate retail sales going into the Christmas season.
While cycles are destined to run for a certain number of time segments, from seconds to centuries, their time can be shortened or lengthened by a change in fundamentals. The prudent investor looks for the reason that will change the trend and shorten or lengthen the cycle.
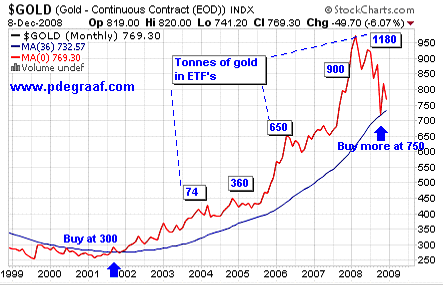
We close this essay with the 10 year gold chart and its 36 month moving average.
(Chart courtesy www.stockcharts.com )

For long-term investors the 36 month moving average makes a great entry point when used on a ‘closing prices' chart. You would have bought at 300.00 as price broke out above the MA and added on recently when price touched the MA at 725. The numbers in boxes represent the number of tonnes of gold that been stashed away into the various ETF's since 2003. This shows demand for physical gold is growing.
Never before in history have so many trends become exponential as those we are witnessing today. On my website I link to a short video titled Exponential Trends.
There is a danger that money supply could go exponential. If that happens, the price of gold and silver will also become exponential.
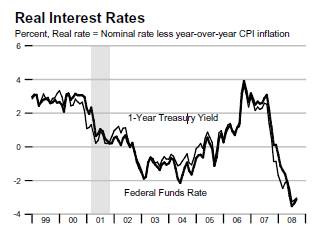
“Real interest rates” are negative. Gold thrives on negative interest rates (T-bill less CPI).

Chart courtesy St. Louis Federal Reserve.
Using the official CPI, the ‘real rates' are -3%. Using data supplied by John Williams at Shadowstats.com the rate is even more negative. Some will argue that rates may be positive next year. Anything is possible, but why not deal with things as they are, instead how they might be. Negative interest rates are fuel for a rise in the price of gold. The Gold Direction Indicator is at a bullish +70%.
My advice: Buy precious metals at regular intervals. Don't worry about the shake-outs that are inevitable. Then hold on, until the Gold:DJIA chart shown above hits 1:1
Note: The quotes used in this essay are part of a collection of Worthwhile Quotes that are found on my website. In all there are 49 pages of quotes that make for interesting reading and research.
By Peter Degraaf
Peter Degraaf is an on-line stock trader with over 50 years of investing experience. He issues a Weekend Report on the markets to his many subscribers. A sample copy of a recent report is available upon request. Long-term charts are available as a free service at his website www.pdegraaf.com (Due to time constraints and growing administrative costs he no longer offers a free trial service).
DISCLAIMER: Please do your own due diligence. I am NOT responsible for your trading decisions.
Peter Degraaf Archive |
© 2005-2022 http://www.MarketOracle.co.uk - The Market Oracle is a FREE Daily Financial Markets Analysis & Forecasting online publication.


