Crude Oil Forecast 2009- Time to Buy?
Commodities / Crude Oil Dec 08, 2008 - 10:51 AM GMTBy: Nadeem_Walayat

 No one could have imagined a little over 4 months ago with crude oil trading at $147, that crude oil would have crashed by 70% and be threatening to break below $40 so soon. Therefore this analysis seeks to to evaluate the prospects for crude oils future trend over the next 12months in determining whether crude oil today is a good buy or not.
Crude Oil Inflation Hedge Unwinding and the Recession.
China and other emerging markets are eyeing the fall in crude oil price to utilise huge trade surplus foreign currency reserves to buy up crude oil reserves exposure wherever possible, this has resulted in less of a decline for oil majors stock prices despite the 70% oil price crash. Crude oil as with all asset classes is being hit by the reversal of the inflation hedging that took place going into mid 2008 that saw crude oil bust through $100 towards $150, the original expectation was for the whole of this inflation hedging to unwind back through $100 and down towards a target of $80 with possible overshoot to the downside once the scale of the credit crisis fully manifested itself. As the oil price rally fed into much higher inflation statistics on the upside, so deleveraging of the inflation hedge is leading to self feeding deflation on the downside which is acting on pushing crude oils to much lower levels than could originally have been estimated.
The deep recession ensures that crude oil demand is being cut faster than that taken up by the emerging economic giants of China and India, also the stronger dollar has ensured that the actual falls in foreign currency terms has been less than for the United States. This implies continued weak trend for crude oil for the duration of the U.S. recession which is the key to crude oils trend for 2009, which given last months job losses of 533,000, the worst data in 34 years illustrates that the U.S. economy is a long way away from recovery with Europe not far behind in terms of economic contraction and therefore precludes a quick sustainable recovery for crude oil prices. However as always traders and investors need to concentrate on the actual price trend rather than the economic data as the price will move long before a change in the economic fundamentals becomes apparent.
Strike Against Iran Rumours
Still rumours persist of a possible attack against Iran's nuclear infrastructure that will drive crude oil prices higher, these rumours are nothing new for they tend to pop up every few months and have been doing the rounds for several years. This is more wishful thinking for perma oil bulls that last occurred in the lead up to the crude oil peak of $147 in July 2008, which at the time I concluded of being an extremely low probability event and which remains so. Those that have clung on to crude oil positions on the basis of this rumour have seen their bull market profits totally wiped out, therefore the key for any market participant remains to watch the oil price and not be mislead down the path of the wishful thinking rumour mill.
Crude Oil Supply / Demand Fundamentals
According to the International Energy Agency world oil demand growth is expected to slow to an average of 86.3 mln bpd during 2009 down from earlier forecasts that approached 87 miln bpd, meanwhile supply is expected to growing at an annual rate of 1.2% and expected to hit 87 mln bpd in 2009, which is less than the previous forecast for global supply growth of 1.6% per annum as the supply growth now reflects the 70% crash in the global oil price. However going forward demand from developed countries is expected to continue to contract at the average rate of 200,000 barrels per day that implies the full impact of peak oil will be put off for as long as another 5 years, implying crude oil volatility during this period where a future sentiment driven crude oil bull market could yet again lead to another price crash as we have witnessed over recent months. Therefore it is important for investors especially in oil price ETF funds to always have in place price targets and mechanisms for exiting out of positions so as to ensure future bull market gains do not evaporate in the face of bear markets.
Crude Oil Technical Analysis

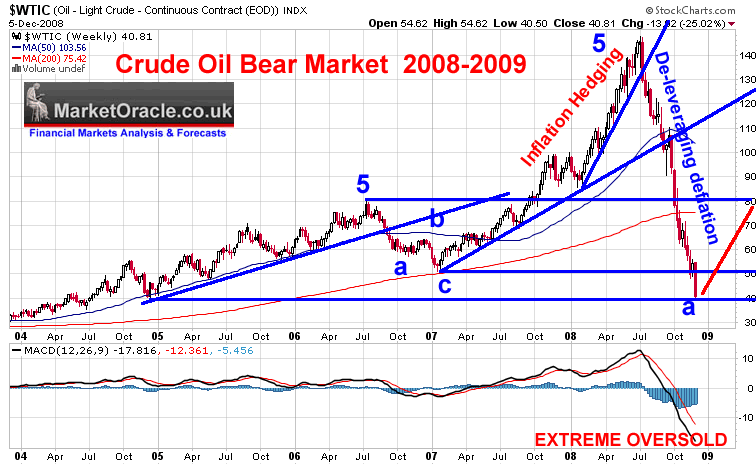
Trend Analysis - Crude oil is clearly in the overshooting to the downside phase, having plunged through the original target of $80, then overshot support at $60, with the final break of the low of $50 and now assaulting on the $40 support level. Further immediate support exists along decades old resistance areas generated during the 1980's in the region of $35. Therefore this suggests further crude oil downside is limited. However the deep retracement suggests a wide trading band of between $80 and $35, therefore expectations of much price volatility during the base building process during much of 2009.
Therefore those now calling on crude oil to head towards $20 are reminiscent of calls for crude oil to hit $200 earlier this year, the overshoot that was going to occur has occurred with the expectations there there is little further downside remaining in future price action. However a bottom has to be formed that will take time to occur.
MACD - The MACD indicator is extremely oversold which implies that further immediate downside is extremely limited which suggests a significant multi month corrective rally is imminent.
Elliott Wave Theory - The peak of July 2007 marked the 5th wave Crude Oil Bull market peak with the subsequent expected pattern to form an ABC correction, that has been confirmed by preceding crude oil bear market outcomes. The current trend lower is clearly an A wave decline which suggests a B wave rally, that could retrace 38.2% of the decline today which projects to $80 and confirms trend analysis for a volatile crude oil trading range during 2009.
US Dollar bull market - The trend in crude oil and most commodities, is not so surprising in that the Dollar bull market remains in tact that will continue to bear down on all commodities during 2009. Previous updates: March 2008 - U.S. Dollar bottom called; August 2008 - U.S. Dollar base building breakout; October 2008 - U.S. Dollar correction into late November expected before continuation of the bull market into early 2009 towards a target of USD 92. More to follow on the U.S. dollar's prospects during 2009 in my fourth US Dollar bull market update later this month.
Crude Oil Forecast 2009
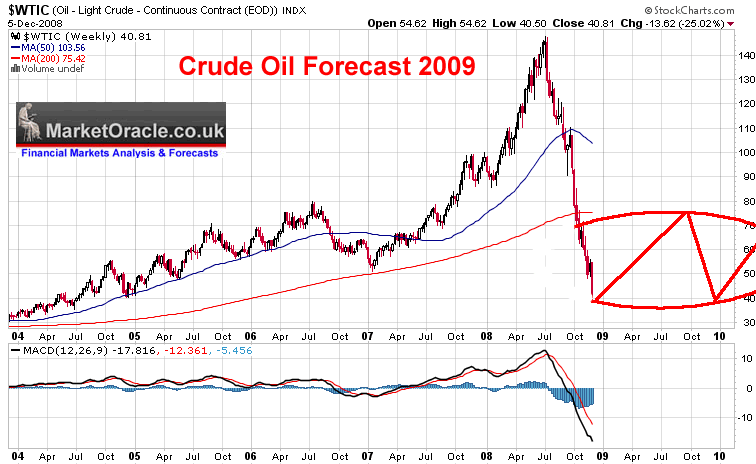
Crude oil is still in a downtrend, that means investors and traders need to WAIT for a buy trigger which normally means the break of a recent high or a significant resistance area ($50) before scaling into a position, and I mean scaling in because it will take much time for crude oil to formulate a bottom that I expect will form a very volatile double or even triple bottom pattern i.e. protracted bottom formation punctuated with very sharp short-covering rallies that could see crude oil spike higher to $80 and declines back to below $50 over the next 12 months as the below graph illustrates. What this anticipated scenario means is that there is TIME for investors to buy into crude oil positions as the base building confirmation takes place, as any strong rallies will likely be followed by tests and probable breaks of the previous low so as to enable the creation of the overall saucer shaped double bottom pattern.
However the long-term trend for crude oil remains higher, when I mean long-term I am looking at well beyond the next 12months towards 5 to 10 years, when I would not be surprised given the peak oil fundamentals that we will actually be visiting the $200 crude targets that were loudly pronounced during mid 2008 as being imminent when crude oil was trading at $147. This scene rios should not be surprising given that the US Dollar bull market remains in tact that will continue to bear down on all commodities during 2009, but more on the dollar in my next (fourth) US Dollar bull market update.

Your PATIENT crude oil long-term exposure accumulating analyst.
By Nadeem Walayat
http://www.marketoracle.co.uk
Copyright © 2005-08 Marketoracle.co.uk (Market Oracle Ltd). All rights reserved.
Nadeem Walayat has over 20 years experience of trading derivatives, portfolio management and analysing the financial markets, including one of few who both anticipated and Beat the 1987 Crash. Nadeem's forward looking analysis specialises on the housing market and interest rates. Nadeem is the Editor of The Market Oracle, a FREE Daily Financial Markets Analysis & Forecasting online publication. We present in-depth analysis from over 150 experienced analysts on a range of views of the probable direction of the financial markets. Thus enabling our readers to arrive at an informed opinion on future market direction. http://www.marketoracle.co.uk
Disclaimer: The above is a matter of opinion provided for general information purposes only and is not intended as investment advice. Information and analysis above are derived from sources and utilising methods believed to be reliable, but we cannot accept responsibility for any trading losses you may incur as a result of this analysis. Individuals should consult with their personal financial advisors before engaging in any trading activities.
Attention Editors and Publishers! - You have permission to republish THIS article. Republished articles must include attribution to the author and links back to the http://www.marketoracle.co.uk . Please send an email to republish@marketoracle.co.uk, to include a link to the published article.
Nadeem Walayat Archive |
© 2005-2022 http://www.MarketOracle.co.uk - The Market Oracle is a FREE Daily Financial Markets Analysis & Forecasting online publication.
Comments
|
Nadeem_Walayat
08 Jul 09, 01:36 |
Crude Oil Forecast Summer 2009 Update
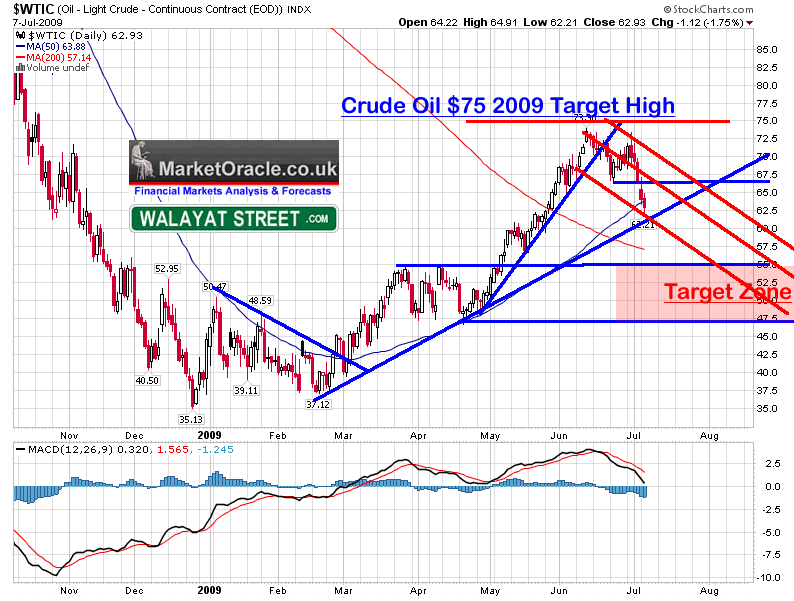
This is a quick update to the analysis of December 2008 that projected an uptrend in the Crude Oil price into mid 2009 targeting $75, to be followed by a downtrend back below $50 towards $40 as illustrated by the original graph.
Crude Oil Summer Trend
Quick Technical Analysis - Crude oil hit its summer objective in June by peaking just shy of $74, following which it made a lower high at 73, and confirmed the downtrend on break below 66. The current action is expected to correct the bull run from $35 in December 2008, with the key consolidation zone of $47.5 to $55 which crude oil is homing in on to again form a base for the resumption of the rally into 2010. Therefore we have a price target zone of $47.50 to $55, the question now is how long will the downtrend last ? The downtrend appears to be projecting for a trend lower into late August / Early September, thereafter some sideways action could be in order before the rally gains traction later in the year. Crude Oil Conclusion - Downtrend targeting $45 to $50 by start of September 2009, thereafter base building before the next leg higher. The in depth update for crude oil will follow later, to ensure you receive this in your email box subscribe to my always free newsletter. Crude Oil Mega-Trend - The long-term mega-trend is for much higher crude oil prices, we will probably see see the $200 oil price that Goldman Sachs were calling and distributing into as crude oil approached $150 last June. However as I pointed out in the analysis of December 2008 and iterated several times during the year that where oil is concerned 2009 will be the year for accumulating long-term investment position. Therefore the trend to $45 gives long-term investors ANOTHER opportunity to accumulate into a mega-trend. Favoured routes are the oil ETF's , oil producers and explorers again spread your risk by using ETF's and investment trusts, and off course theirs Russia, a crashed stock market that has so far failed to recover despite the recent rebound in the oil price, again this would need to be a long-term exposure. Leveraged ETF's Warning I was going to write at depth as to why investors should steer well away from leveraged ETF's such as that for crude oil, where even if your RIGHT and the price of oil doubles as it did, you could STILL LOSE MONEY!, Leveraged ETF's should be avoided by all but ultra-short-term traders and I am talking about 1 to 3 days, any more and your trading the wrong vehicle, instead I see infuriating commentary on the internet targeting investors towards leveraged ETF's ! In my opinion THEY ARE A SCAM INVESTMENT DESIGNED TO PART YOU WITH YOUR MONEY. Short-term trading vehicle?, maybe, but Investment vehicle - NO!. Ron Rowland explained earlier in detail how they work - Understanding The Dangers of Leveraged ETF's. Inflation / Deflation The higher crude oil rose during the first half of 2009, the greater were the expectations for much higher inflation, in fact at the peak these tipped into many calls for hyperinflation. Now as crude oil has begun is downtrend the deflation argument has again come to the fore as the more dominant outlook.
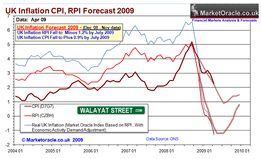
Therefore my conclusion remains that after deflation ends in the coming months, inflation looks set to remain weak into the end of 2009 and most likely for the first half of 2010 at least. I will elaborate up on the inflation outlook and forecast for 2010 later this year. So I do not see forward signs of either deep deflation or hyperinflation, but rather weak inflation for the next 6 to 12 months. Economy The falling oil price acts as a stimulus to economy so should 'eventually' be positive for the stock market, the pattern of trend of which is expected to be inline with my outlook for the stock market. By Nadeem Walayat Copyright © 2005-09 Marketoracle.co.uk (Market Oracle Ltd). All rights reserved. Nadeem Walayat has over 20 years experience of trading derivatives, portfolio management and analysing the financial markets, including one of few who both anticipated and Beat the 1987 Crash. Nadeem's forward looking analysis specialises on the housing market and interest rates. Nadeem is the Editor of The Market Oracle, a FREE Daily Financial Markets Analysis & Forecasting online publication. We present in-depth analysis from over 250 experienced analysts on a range of views of the probable direction of the financial markets. Thus enabling our readers to arrive at an informed opinion on future market direction. http://www.marketoracle.co.uk Disclaimer: The above is a matter of opinion provided for general information purposes only and is not intended as investment advice. Information and analysis above are derived from sources and utilising methods believed to be reliable, but we cannot accept responsibility for any trading losses you may incur as a result of this analysis. Individuals should consult with their personal financial advisors before engaging in any trading activities.
|
|
|
Dave in Florida
03 Nov 10, 00:09 |
Crude Oil Forecast
Is the crude oil forecast for 2010 from the Inflation Mega-Trend E-Book still relevant or ready for update? |
|
|
Nadeem_Walayat
03 Nov 10, 00:29 |
Analysis
Oil forecast needs updating since its now over 9 months old. My focus remains in working towards a multi-year UK house price forecast which consumes most of time I have available for indepth analysis. As part of this series, next will be a forecast on UK interest rates. |


